Guided Tutorial Hardware Considerations
Introduction
One of the more basic (and also incredibly useful) things you can do in GNU Radio with a receiver is to create a software radio spectrum analyzer. This is also a great first step because it will verify that your hardware has basic functionality.
What Will I Need?
There is a large and growing number of SDRs that have GNU Radio support. They span from very cheap ($20) receivers like the RTL-SDR to very high-performance tens-of-thousands-of-dollars systems. Examples of four popular devices are presented below. Other devices are listed in Hardware.
Creating a Software Radio Spectrum Analyzer
This example uses an USRP Source block, so it should work for almost all USRP SDRs, such as the USRP B series which have a continuous frequency coverage from 70 MHz to 6 GHz and a maximum sample rate of 56 MHz.
In order to use UHD blocks, you must have UHD installed, although most methods of installing GNU Radio come with UHD. See InstallingGR for more info.
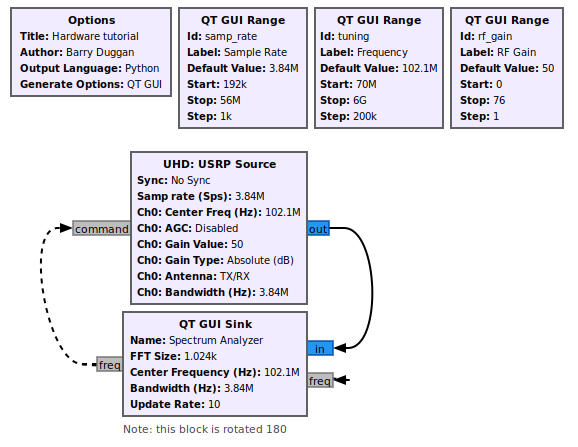
Using gnuradio-companion (GRC), build the following flowgraph.
Setting Parameters
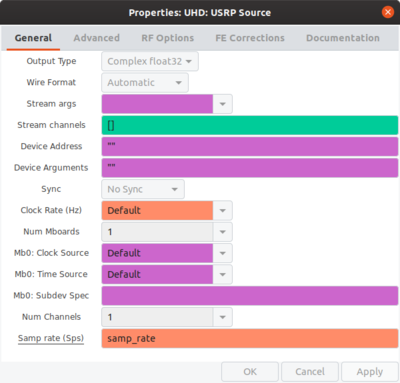
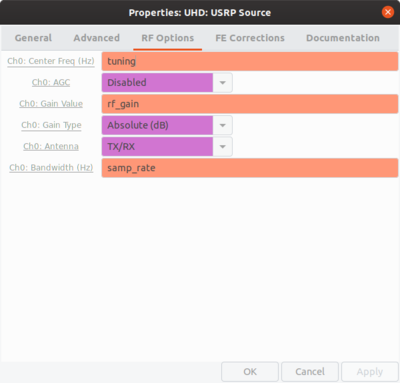
The USRP Source parameters are set as shown below.
Note that we want the Automatic Gain Control (AGC) to be disabled, because we will be browsing spectrum that often will be empty, and it's tough to tell when a signal is present or not when the AGC is constantly adjusting the gain so that the received samples are always at a constant level. You can think of AGC like something automatically adjusting the volume knob. AGC being enabled is better suited for applications when you know a signal exists on the frequency you are tuned to.
Tuning and Using the Spectrum Analyzer
Set the following parameters in the QT GUI Sink block:
- Center Frequency (Hz): tuning
- Bandwidth (Hz): samp_rate
- Show RF Freq: Yes
- Show Msg Ports: True
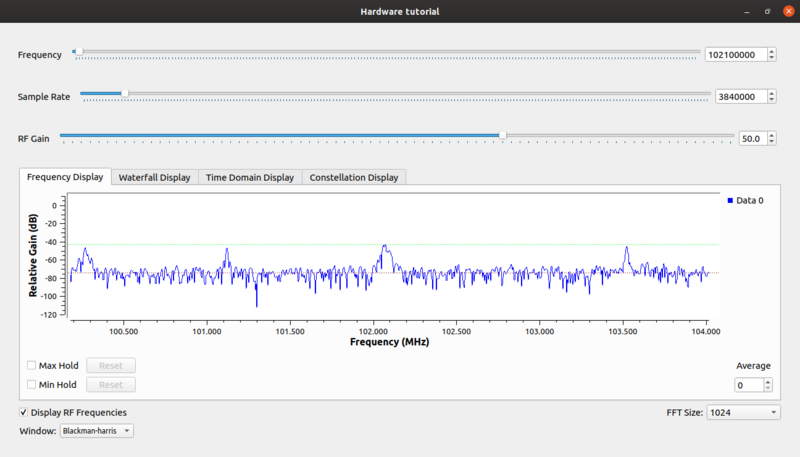
The analyzer can be tuned with the Frequency control widget. If you check the "Display RF Frequencies" box in the run-time GUI window, then the scale on the 'Frequency Display' and 'Waterfall Display' tabs will show the actual frequencies with the tuned frequency in the center. Keep in mind that the IQ samples coming from the SDR are at baseband, i.e. at 0 Hz, the signal was down-converted to baseband before it was sampled by the Analog to Digital Converter (ADC).
With the message output of the QT GUI Sink block (freq) connected to the message input (command) of the USRP Source, you can double click the display on the Frequency or Waterfall screens and it also will tune to the selected frequency. This is useful for centering on a signal. Before you click, the frequency will be displayed with the cursor.
You can adjust the Sample Rate to see more or less spectrum at a time (because these SDRs use quadrature sampling, the amount of bandwidth we see at once is equal to the sample rate). This trace shows four FM stations.
Hardware Considerations
Setting the sample rate involves several factors to consider.
- The various hardware devices have limits on what sample rates they can deliver. Some, such as the FunCube Pro+, have a fixed sample rate of 192kHz. Setting the flowgraph sample rate must be within the limitations of the device.
- The computer hardware and operating system you are using will set limitations on the data throughput, such as:
- USB2 vs USB3
- processor speed
- number of CPU cores
- If you are using a USRP, data overruns are indicated by the letter 'O' displayed on the terminal screen. These are because the input data stream is producing data faster than the computer can consume it, so it could be due to a USB bottleneck, or the flowgraph is trying to do too much with those samples, or the CPU is not powerful enough, etc. Adjusting the sample rate and/or the input buffer size (where available) may alleviate the problem.
Building an FM Receiver
Now that you have a tested input device, you can build an FM Receiver with it. See the following flowgraphs.
- USRP FM Receiver flowgraph
- PlutoSDR FM Receiver flowgraph
- FunCubePro+ FM Receiver flowgraph
- RTL-SDR FM Receiver flowgraph
For audio considerations, see Audio_Sink.


