QT GUI Bercurve Sink
The Bercurve Sink block creates a plot of Bit Error Rate versus Signal to Noise ratio (ES/No). The block calculates the BER itself internally by comparing the original data (pre-distortion) from input i with the post-distortion, post-decoding data on input i+1. So (input_items[i] XOR input_items[i+1]) is the BER to plot for that particular Es/No point. Each curve is made with 8 data points, thus requiring 16 input ports.
The Bercurve Sink can operate in two modes:
- Separate input ports
- Bus input ports
Separate input ports
Using gnuradio-companion (GRC), the default configuration of a new Bercurve Sink is with 16 separate input ports per curve. The ports are paired: (0, 1), (2, 3), ... (14,15). Each input pair produces one point on the corresponding curve.
Bus input ports
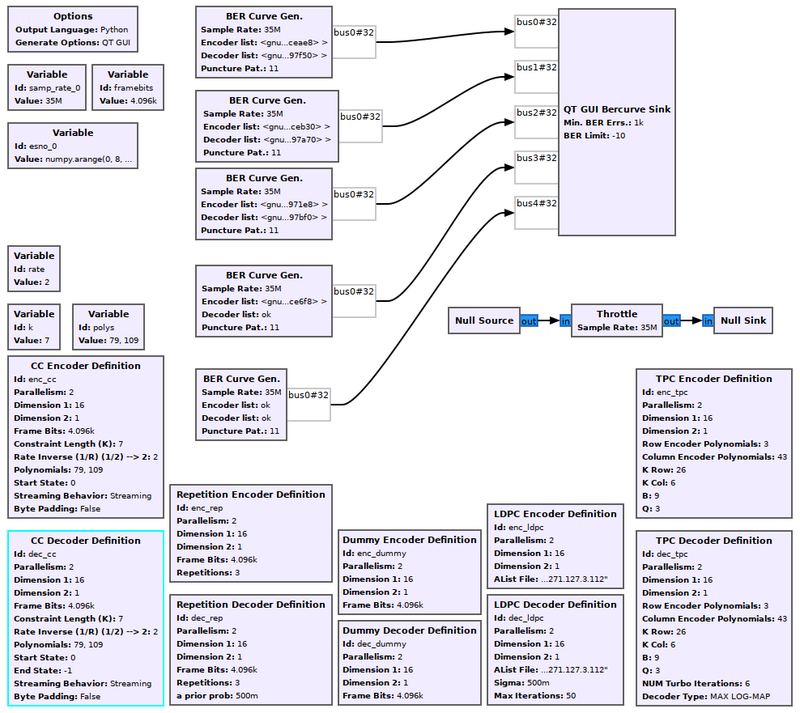
Instead of having so many separate input ports (16 times the number of curves), the sink can operate in the "Bus" mode, where all the data for one curve is grouped into one "bus". To activate this mode, right click on the Bercurve Sink block, select "More", then select "Toggle Sink Bus". This mode matches the output of a "BER Curve Gen." block. See the example flowgraph below.
Parameters
- esno
- Vector of SNR (ES/No) values to plot for. Typical value is
numpy.arange (0, 8, .5)
- Min. BER Errs.
- BER Limit
- Num Curves
- Number of curves to draw on the same graph
- Curve Names
- Y min
- Y max
- Update Period
- GUI Hint
- See GUI Hint for info about how to organize multiple QT GUIs
- Line X Label
- Line X Width
- Line X Color
- Line X Style
- Line X Marker
- Line X Alpha
Example Flowgraph
This flowgraph is derived from https://github.com/gnuradio/gnuradio/blob/master/gr-fec/examples/ber_curve_gen.grc
Source Files
- C++ files
- [1]
- Header files
- [2]
- Public header files
- [3]
- Block definition
- [4]
