Uploads by Jesternofool
Jump to navigation
Jump to search
This special page shows all uploaded files.
| Date | Name | Thumbnail | Size | Description | Versions |
|---|---|---|---|---|---|
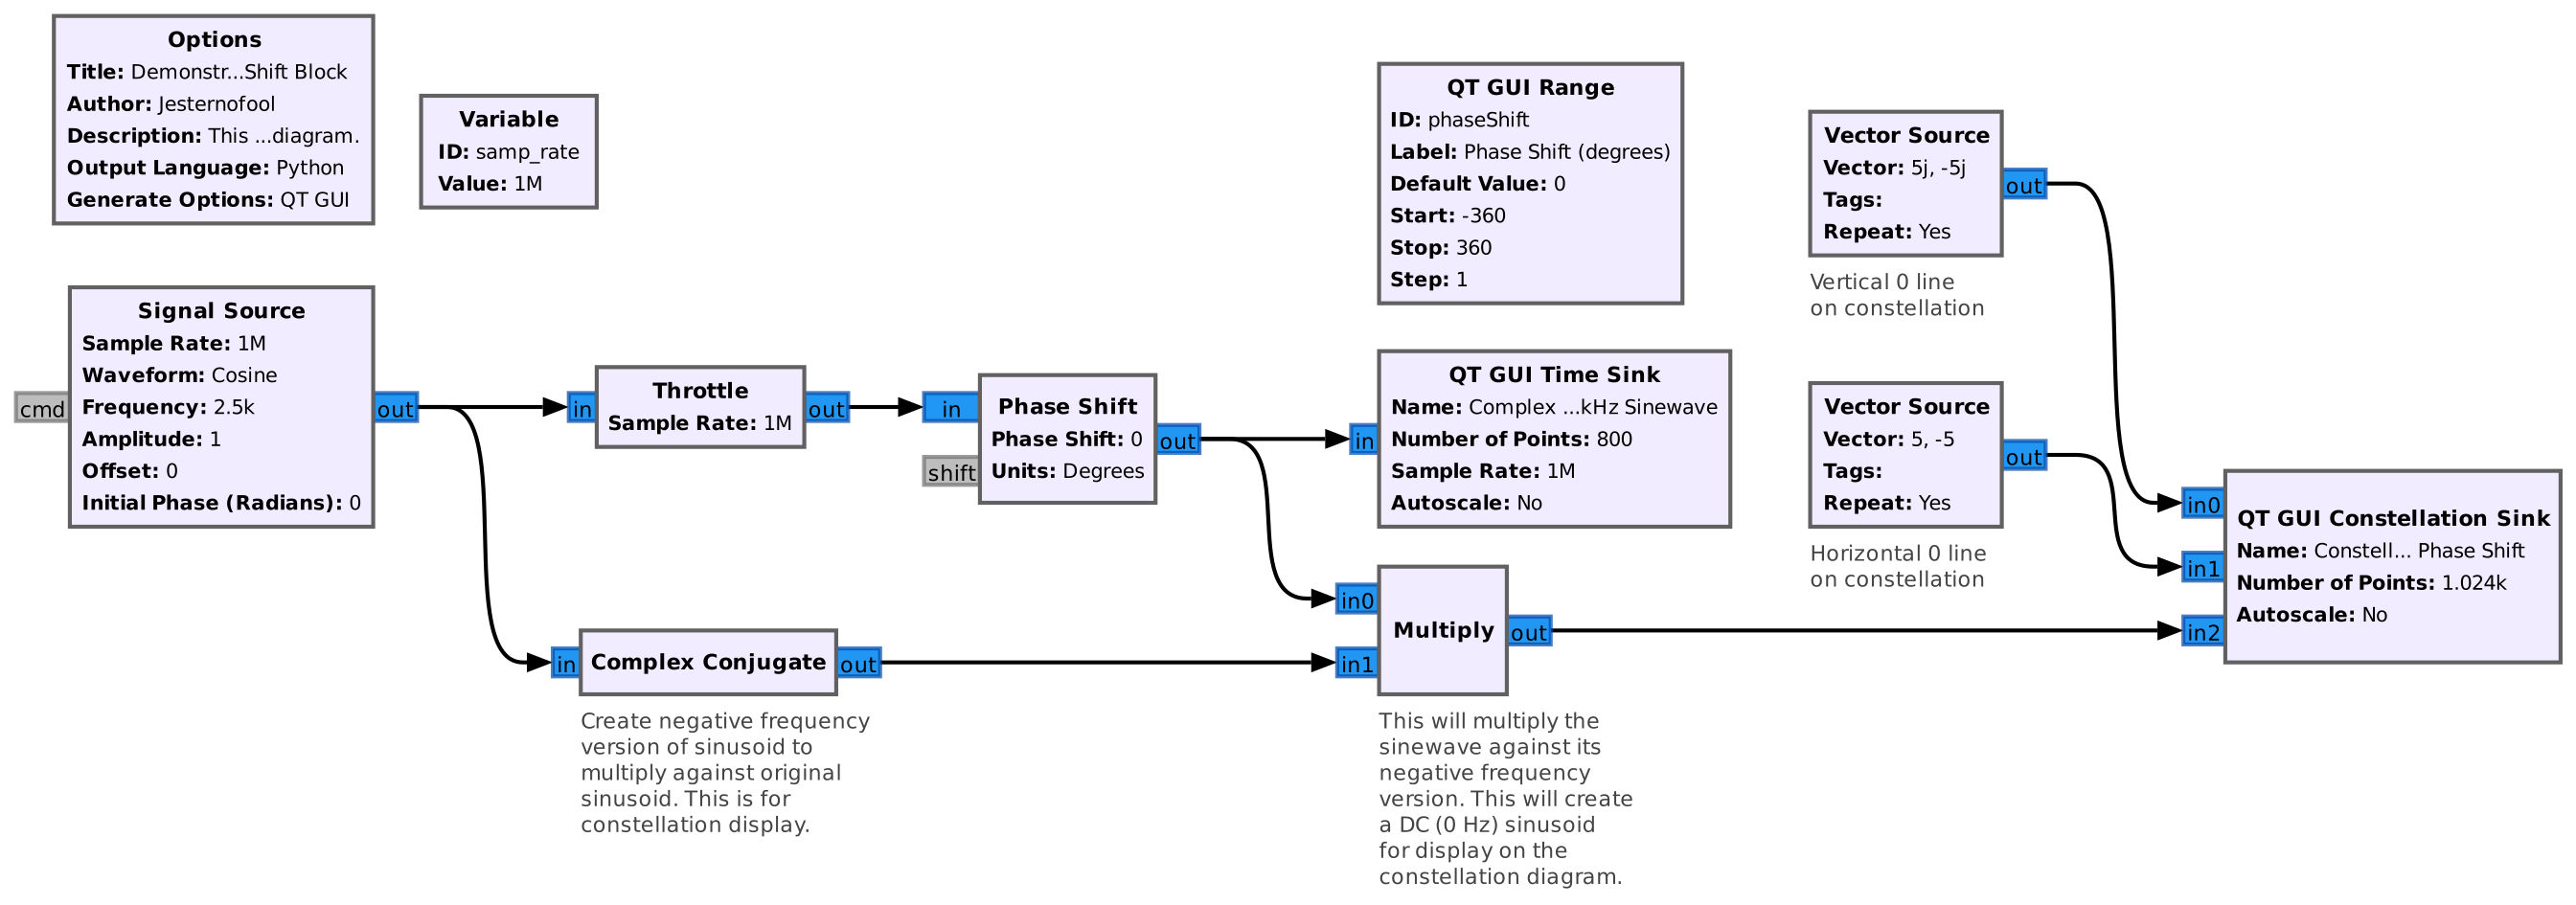
| 18:17, 12 April 2024 | PhaseShiftDemo.jpg (file) |  |
198 KB | Demonstration of the "Phase Shift" block using a time domain (time sink) and constellation diagram. | 1 |
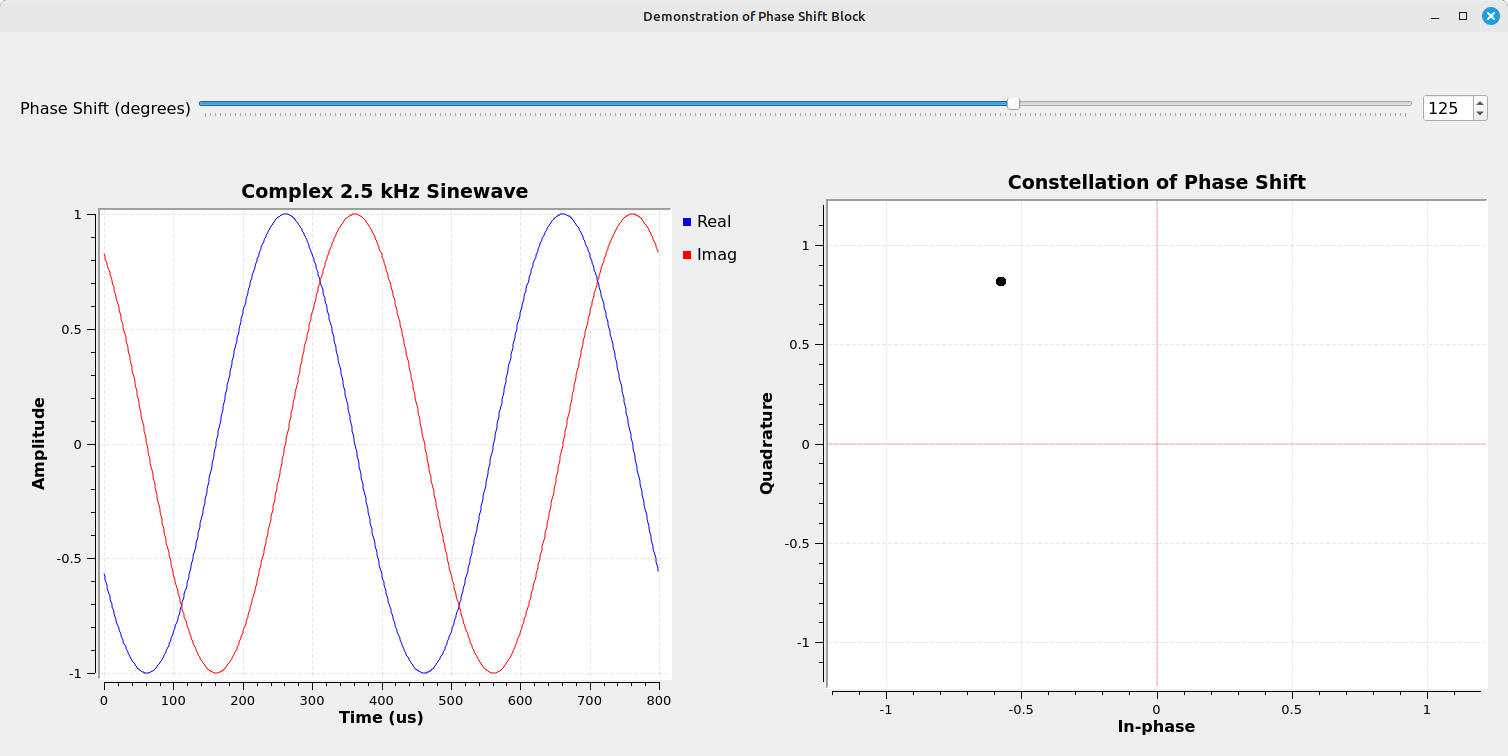
| 19:24, 12 April 2024 | Phase-shift-demo-display.png (file) |  |
62 KB | This is the time domain (left) and constellation (Argand) diagram showing the phase shift of a complex sinusoid. The phase has been shifted +125 degrees (3π/4 radians). | 1 |
| 01:45, 13 April 2024 | PhaseShiftDemo.grc (file) | 8 KB | This is the GRC file used to demonstrate the Phase Shift block. | 1 | |
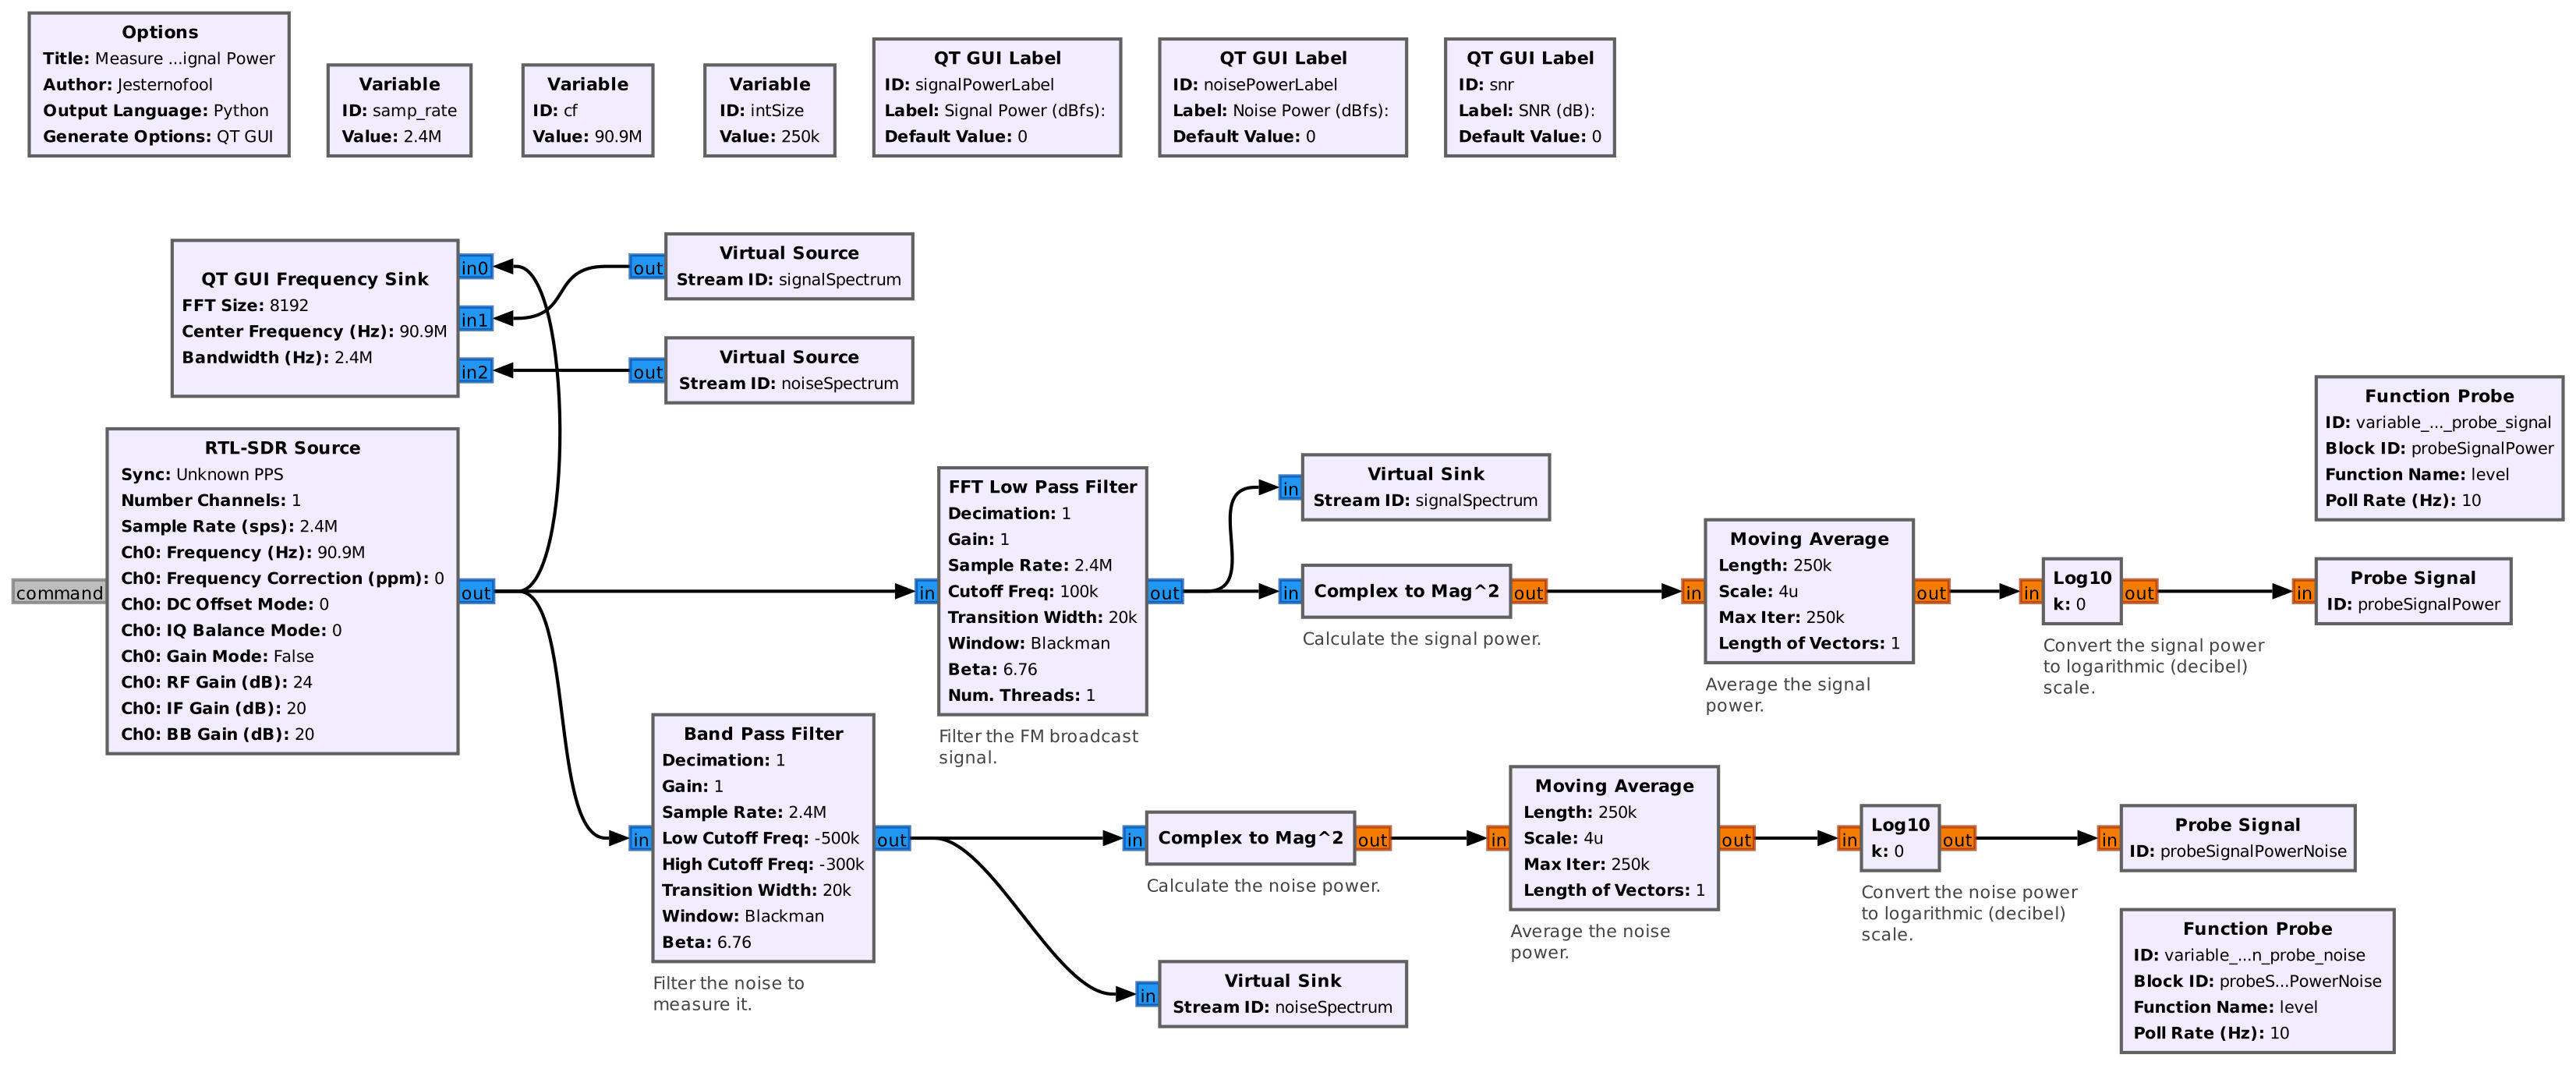
| 16:47, 13 April 2024 | MeasureFmSignalPower.jpg (file) |  |
365 KB | This is a flowgraph that will calculate the signal-to-noise ratio (SNR) of a FM broadcast station using a RTL-SDR. This flowgraph demonstrates both measuring signal power and use of the '''Complex to Mag^2''' block. | 1 |
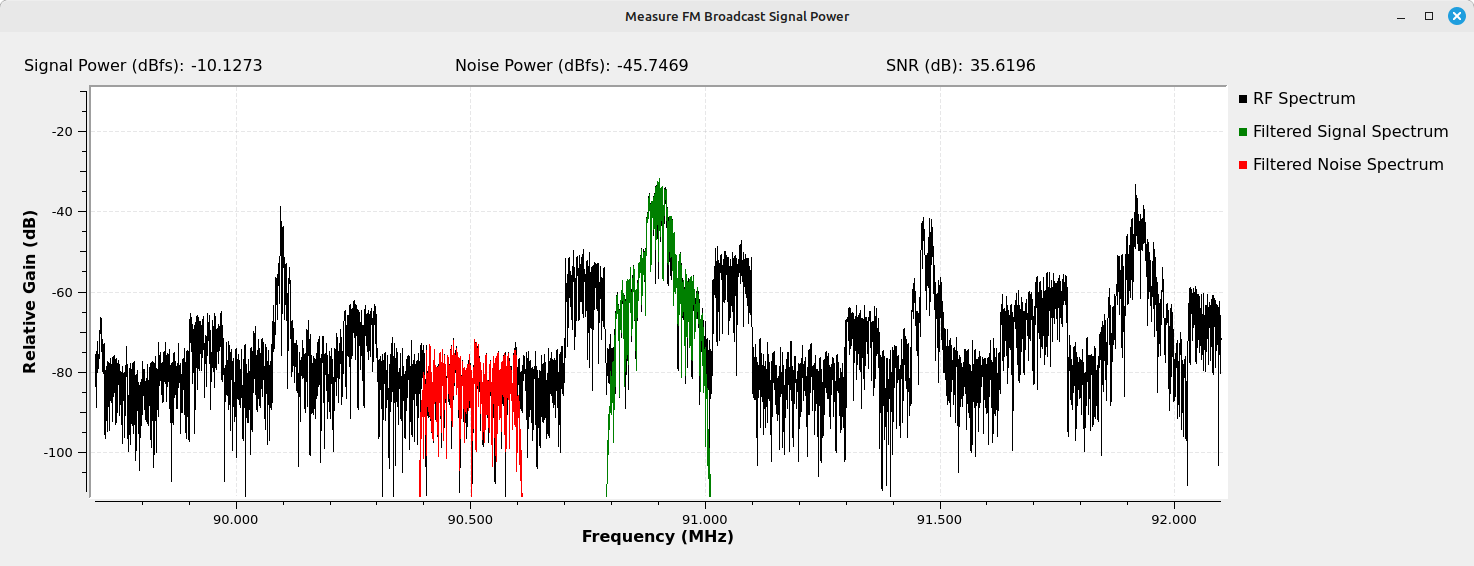
| 16:55, 13 April 2024 | Measure-signal-power-display.png (file) |  |
52 KB | Display from the flowgraph used to measure the signal-to-noise ratio (SNR) of a FM broadcast station. | 1 |
| 17:00, 13 April 2024 | Complex-to-Mag2-block.png (file) |  |
5 KB | This is the GRC display of a Complex to Mag Squared block. | 1 |
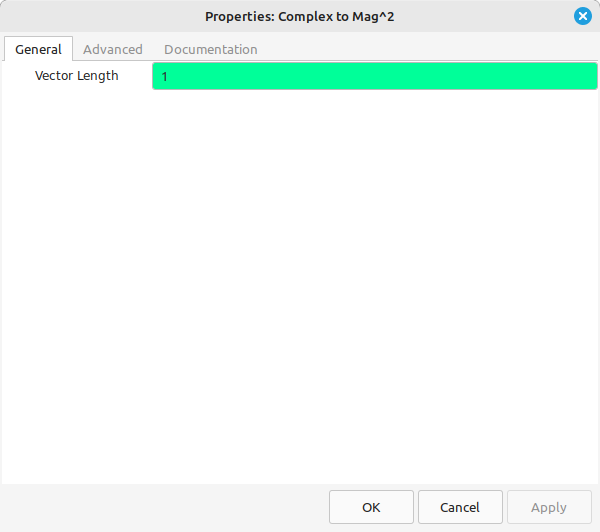
| 17:03, 13 April 2024 | Complex-to-Mag2-block-properties.png (file) |  |
14 KB | Property window for the Complex to Mag Squared block. | 1 |
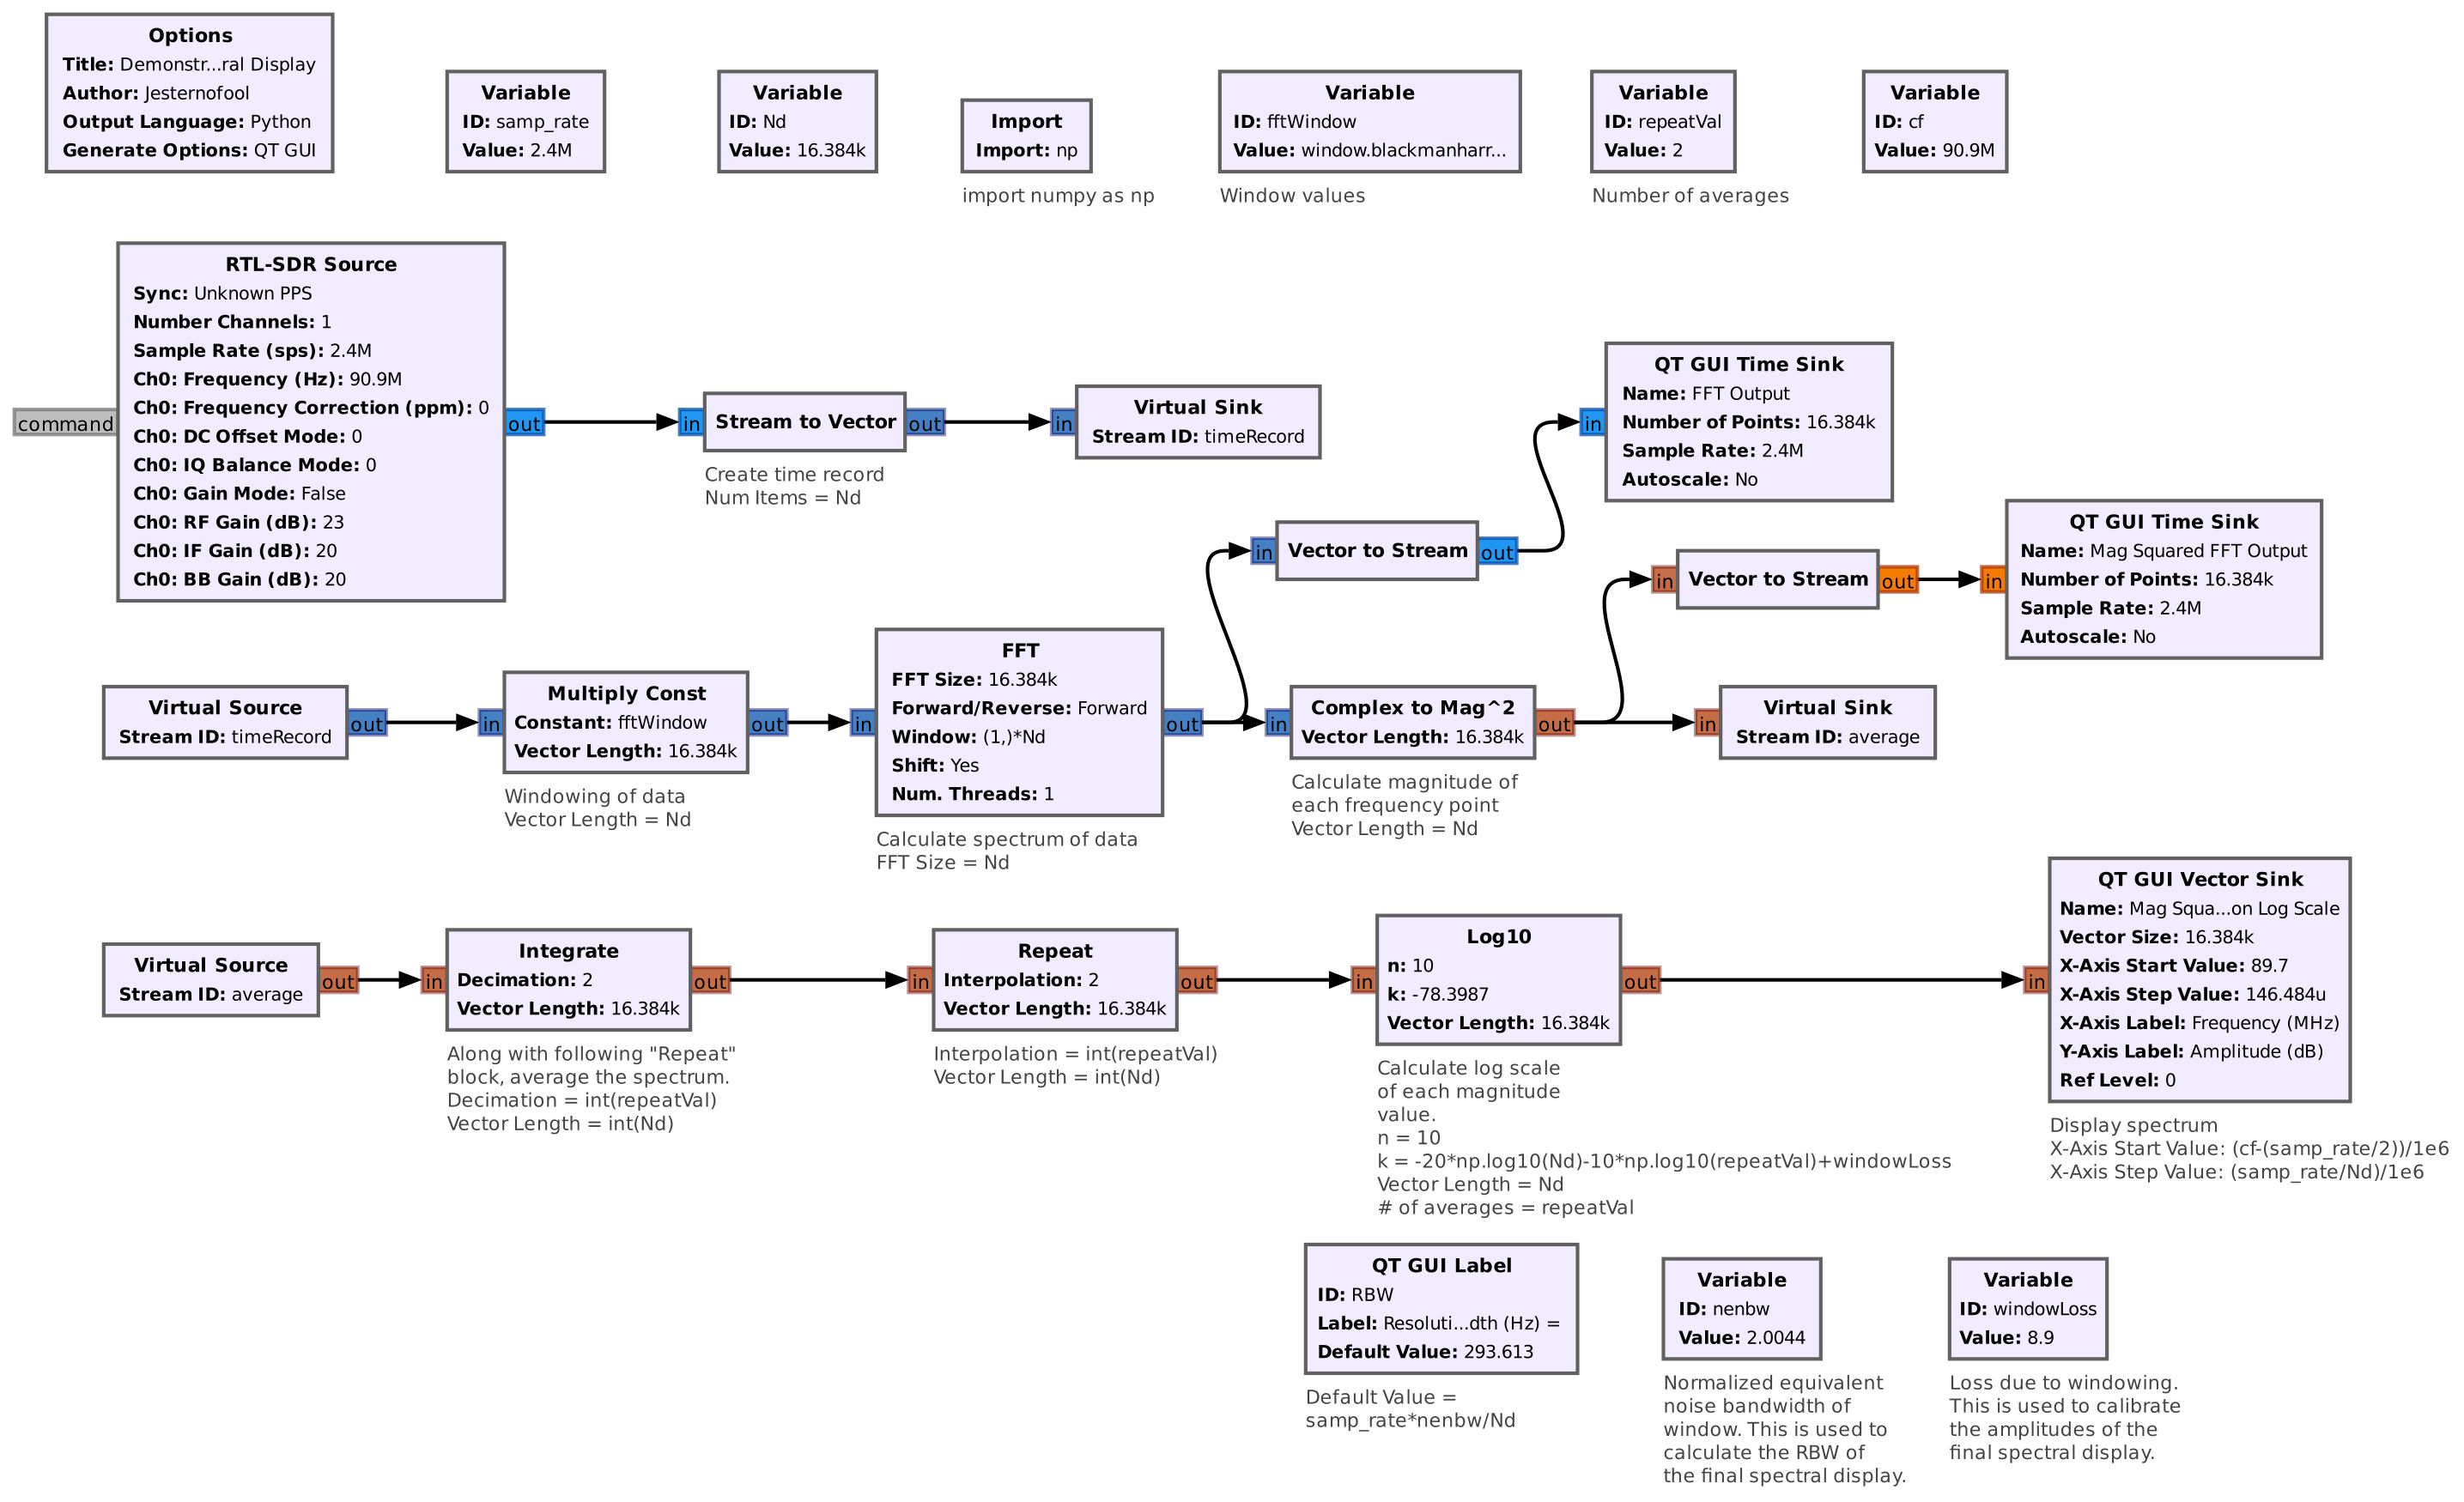
| 17:13, 13 April 2024 | ComplexMagSquaredSpectrum.jpg (file) |  |
412 KB | Flowgraph used to create a basic spectral display. This demonstrates several blocks, including the FFT and Complex to Mag Squared blocks. | 1 |
| 17:20, 13 April 2024 | ComplexMagSquaredSpectrum.grc (file) | 21 KB | Flowgraph used to create a basic spectral display. This is used to demonstrate how a spectral display is created using the FFT and Complex to Mag^2 blocks. | 1 | |
| 17:22, 13 April 2024 | MeasureFmSignalPower.grc (file) | 17 KB | Flowgraph used to measure the signal-to-noise ratio (SNR) of a FM broadcast station. This flowgraph demonstrates a use of the Complex to Mag^2 block. | 1 | |
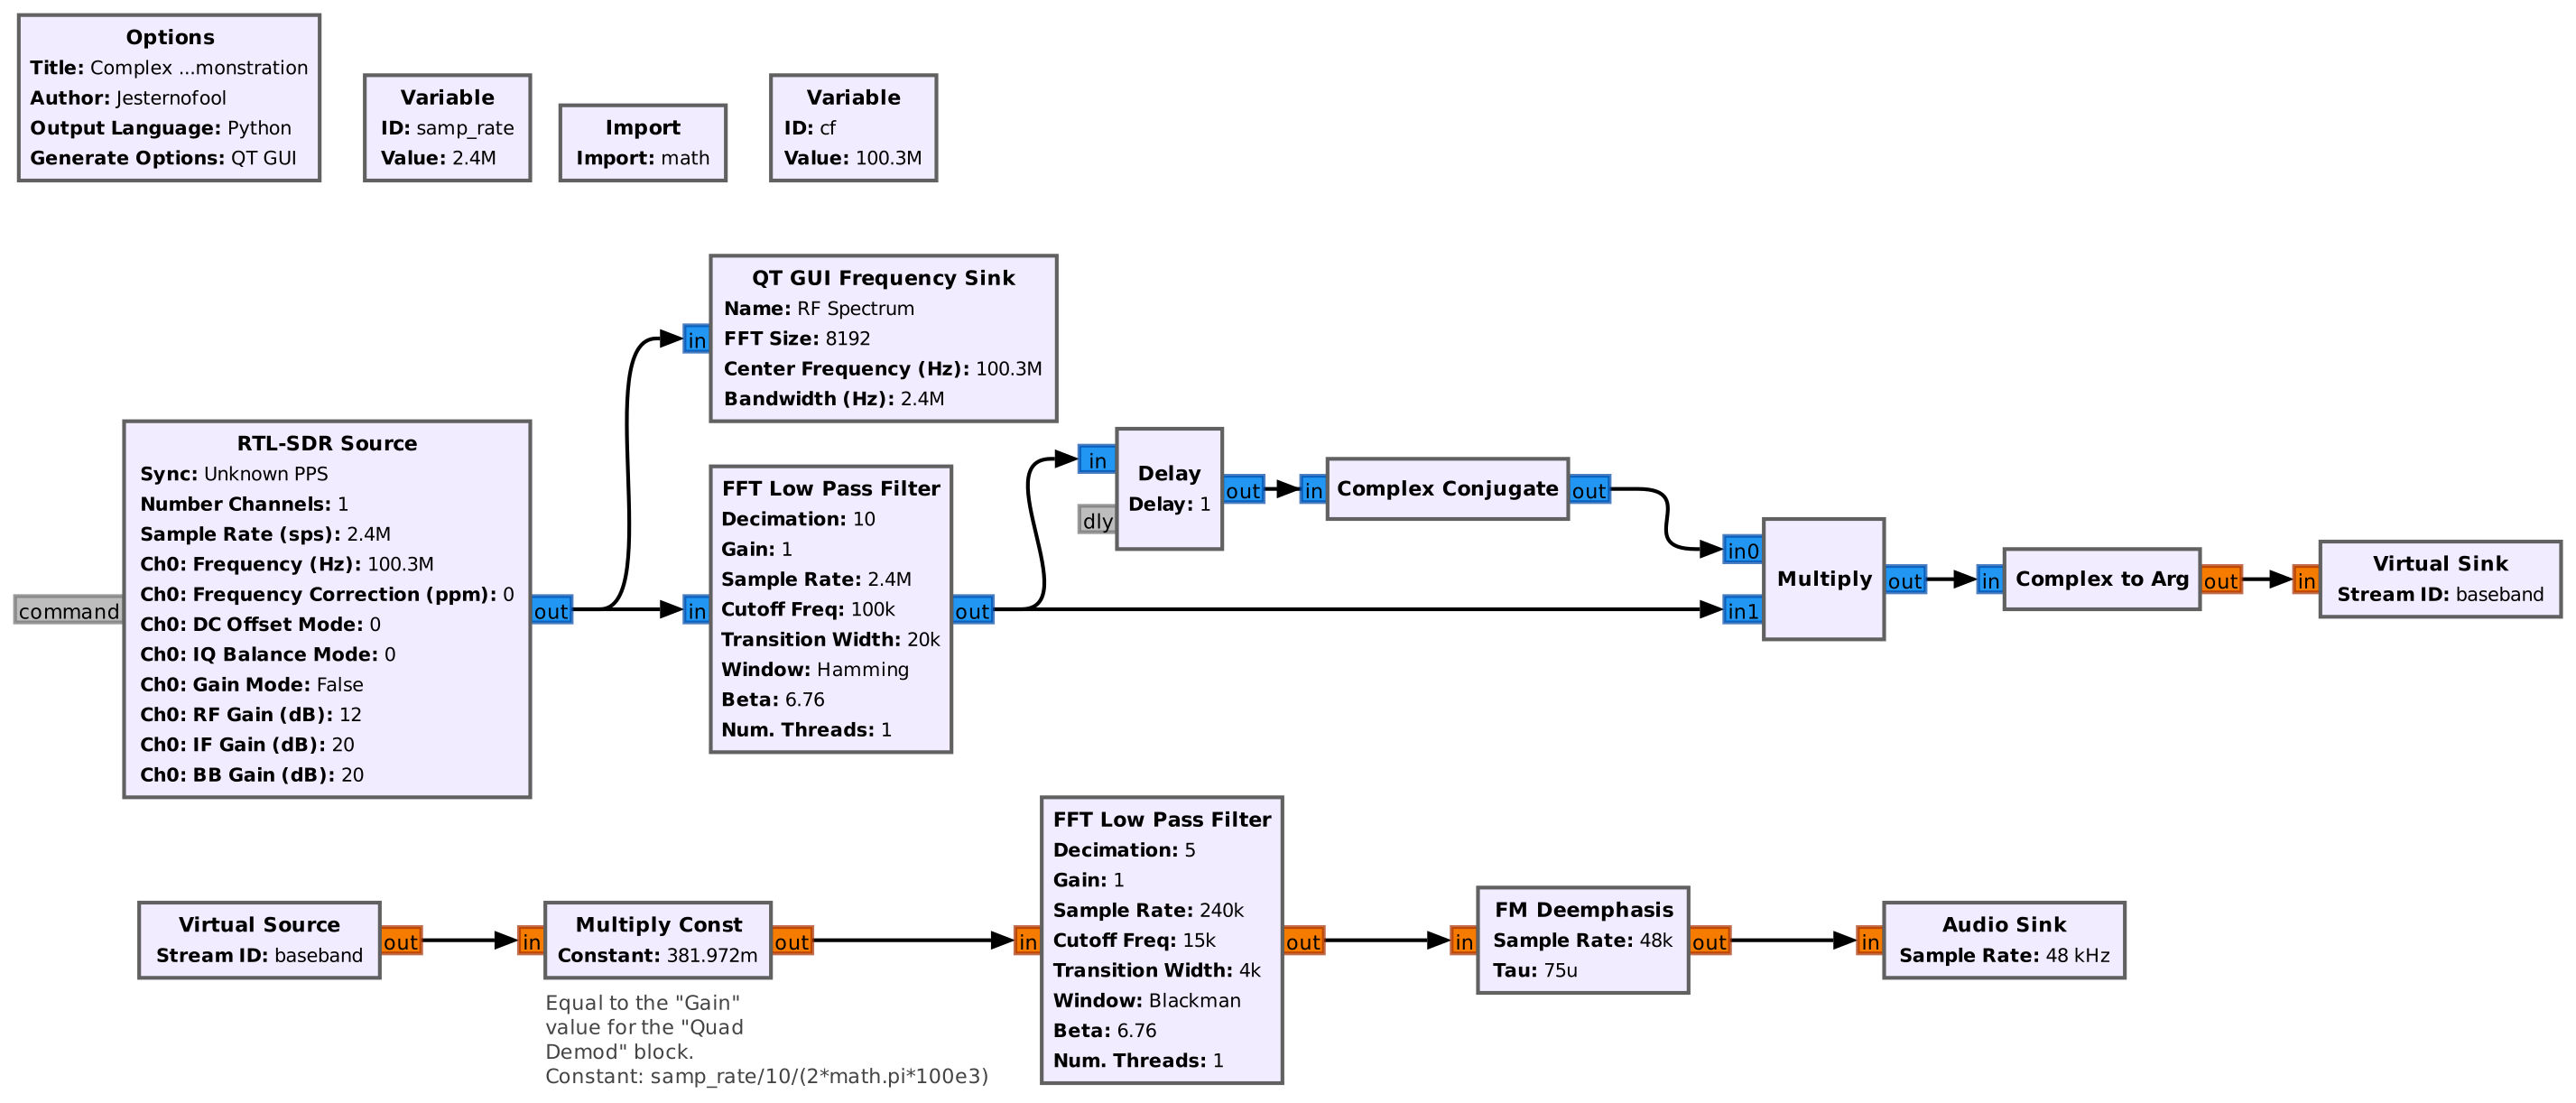
| 18:40, 13 April 2024 | Complex2ArgDemo.jpg (file) |  |
239 KB | This flowgraph demodulates a FM broadcast station. It demonstrates using the "Complex to Arg" block. The blocks from the output of the lowpass filter to the output of the "Multiply Const" block are equivalent to the "Quadrature Demod" block. | 1 |
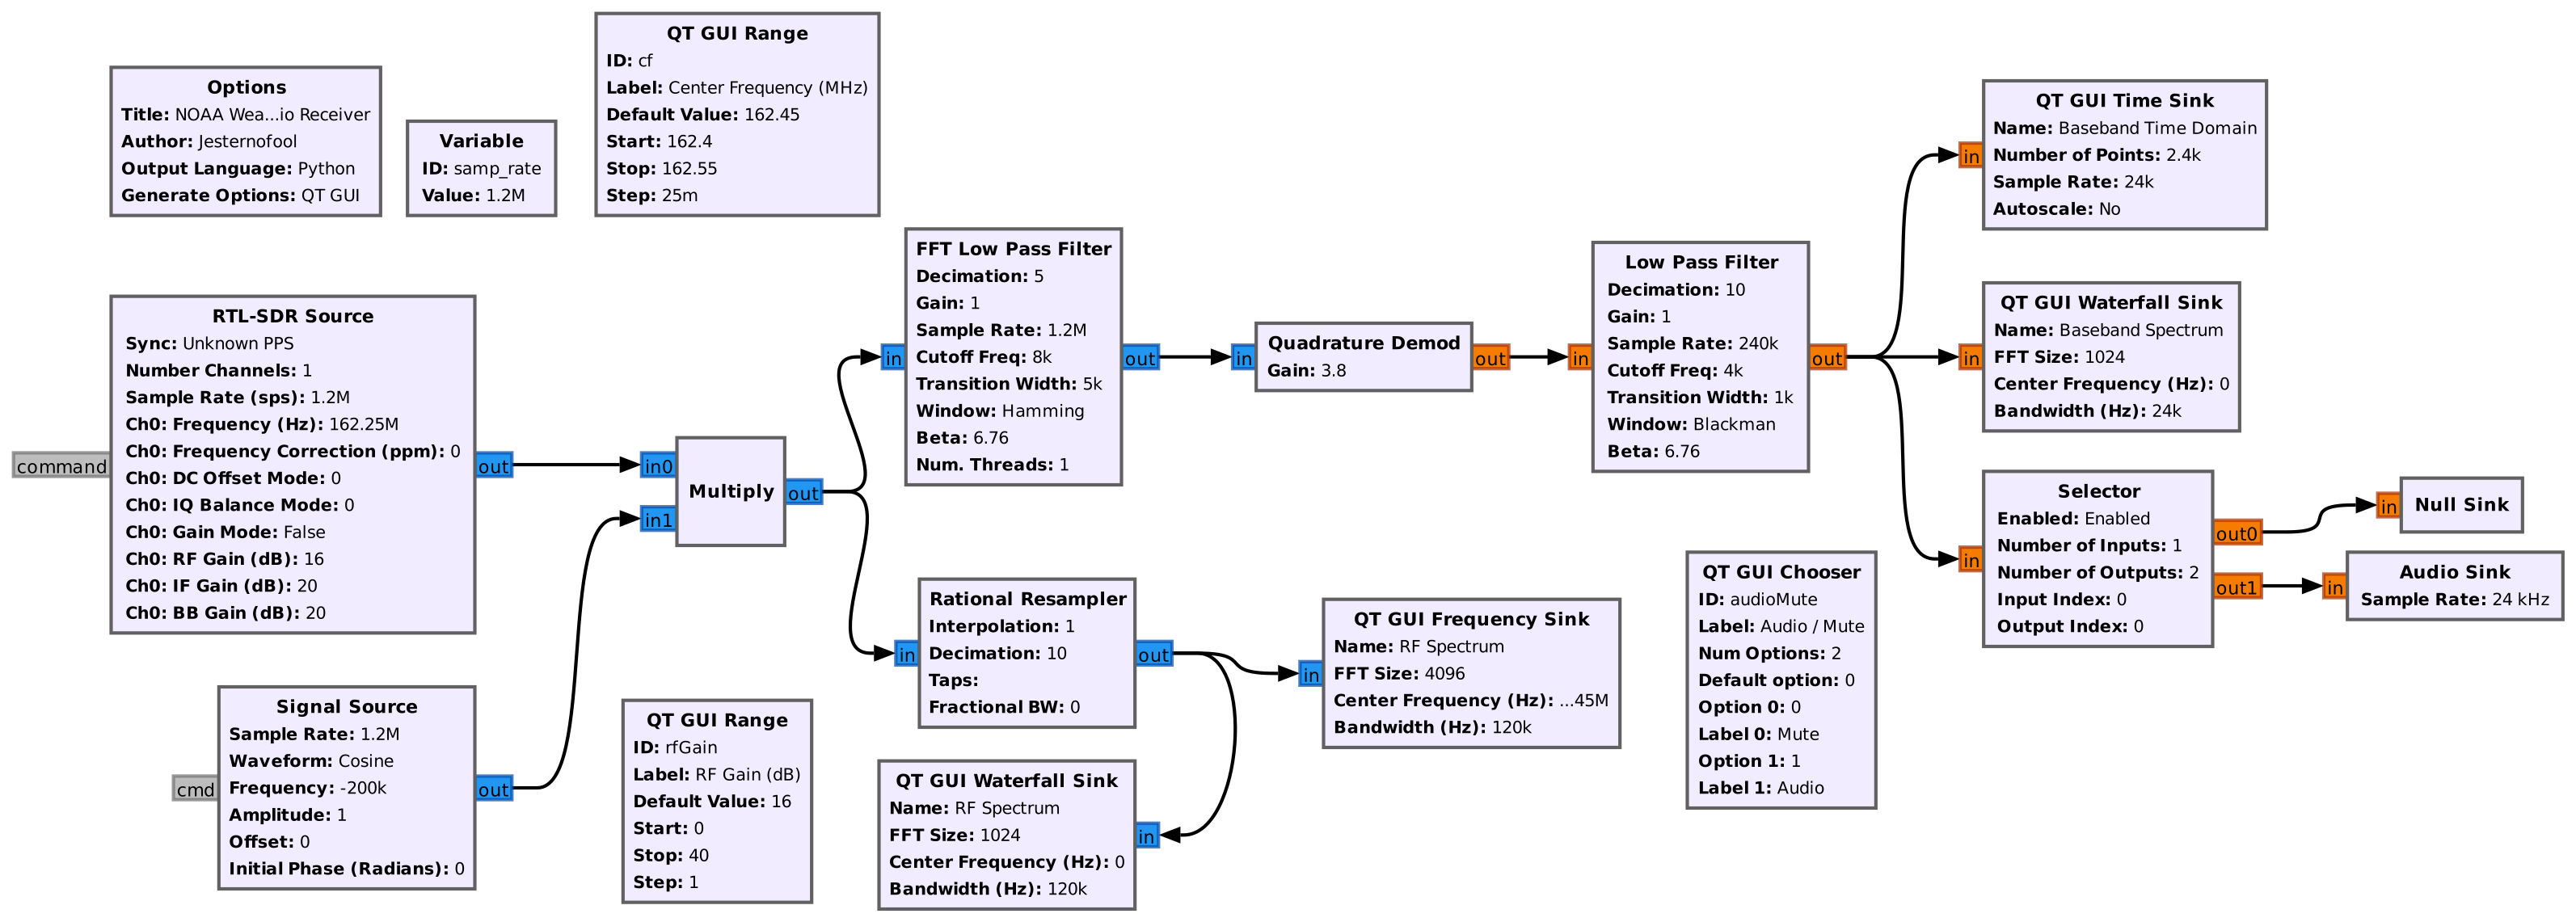
| 19:32, 13 April 2024 | NwrReceiver.jpg (file) |  |
327 KB | NOAA Weather Radio (NWR) receiver, to include both frequency and time domain displays. This flowgraph demonstrates the FFT Low Pass Filter block. | 1 |
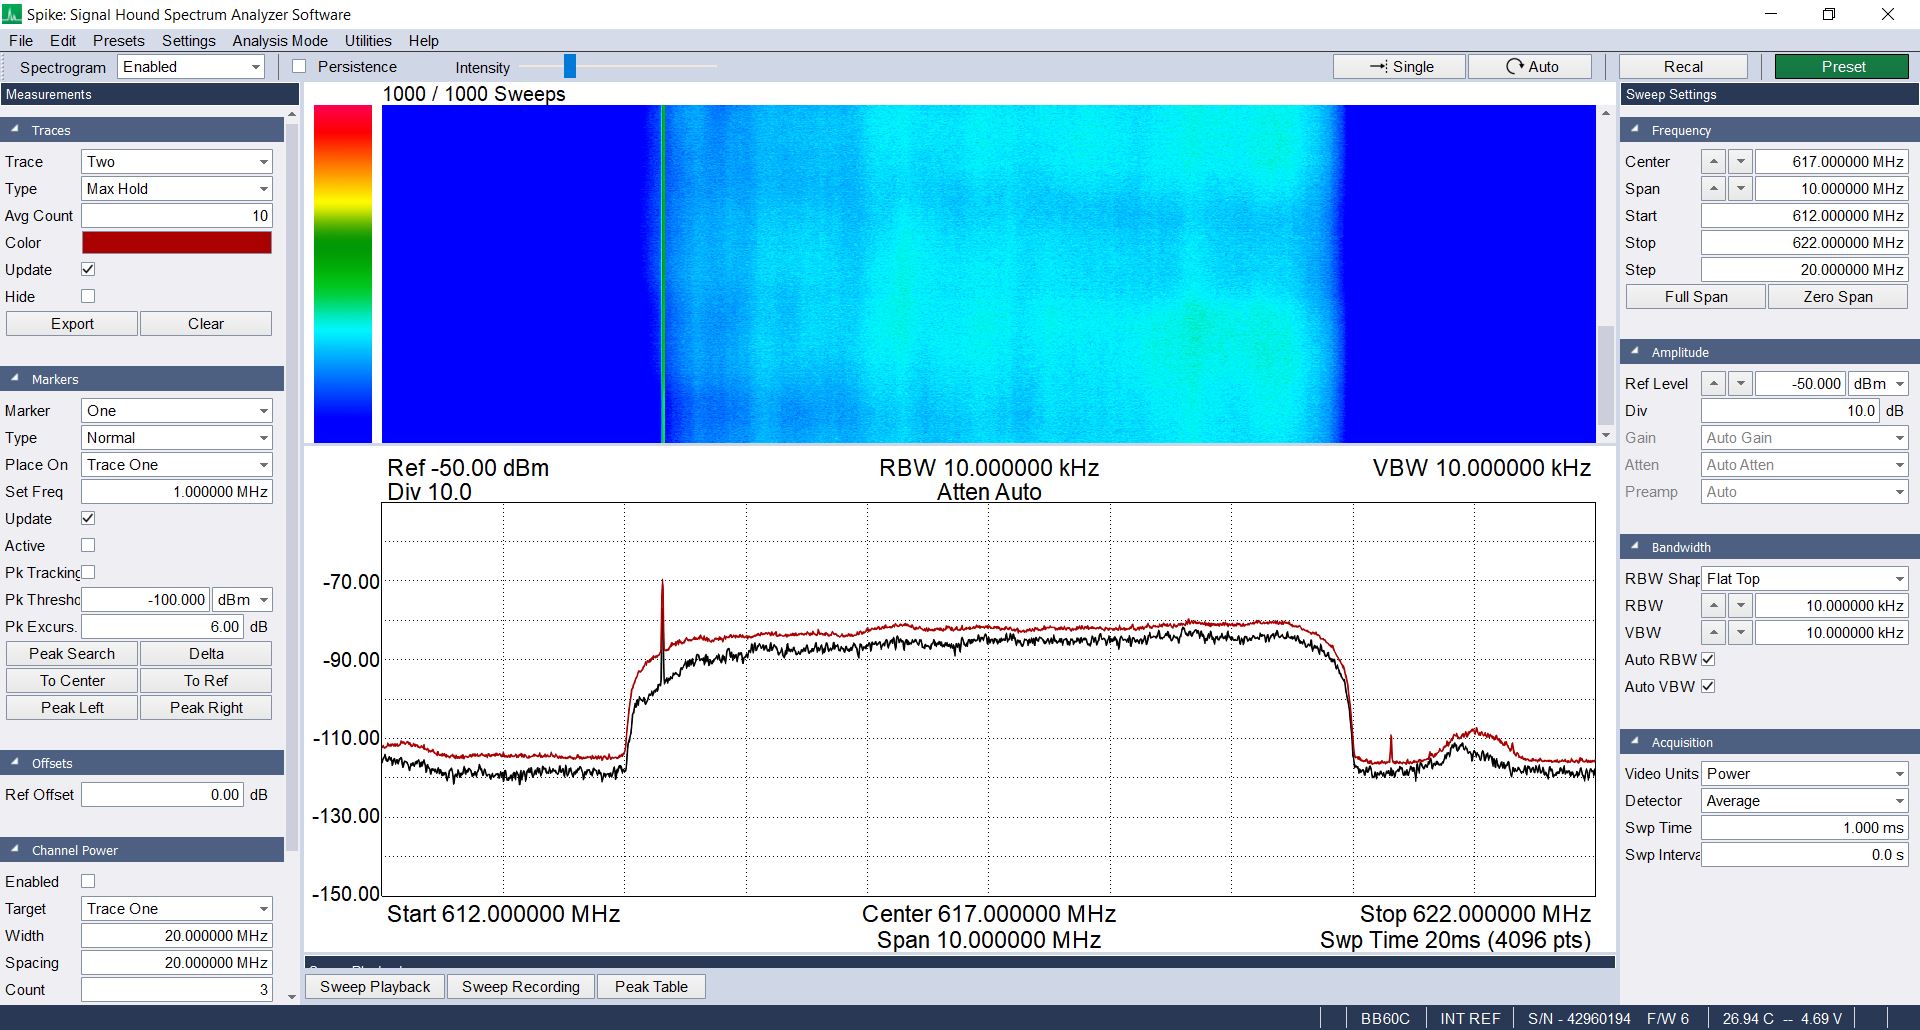
| 12:31, 11 May 2024 | ATSC-Ver3-Ch25-02.png (file) |  |
989 KB | Spectrum and spectrogram of ATSC 3.0 signal. The portion of the signal seen to the right of the 3.0 signal is a ATSC 1.0 transmission. The pilot tone for that transmission is the spectral line on the right. | 1 |
| 12:50, 11 May 2024 | ATSC04-Ch38.jpg (file) |  |
324 KB | ATSC 1.0 spectrum and spectrogram. The spectral line on the left edge of the signal is the pilot tone. | 1 |
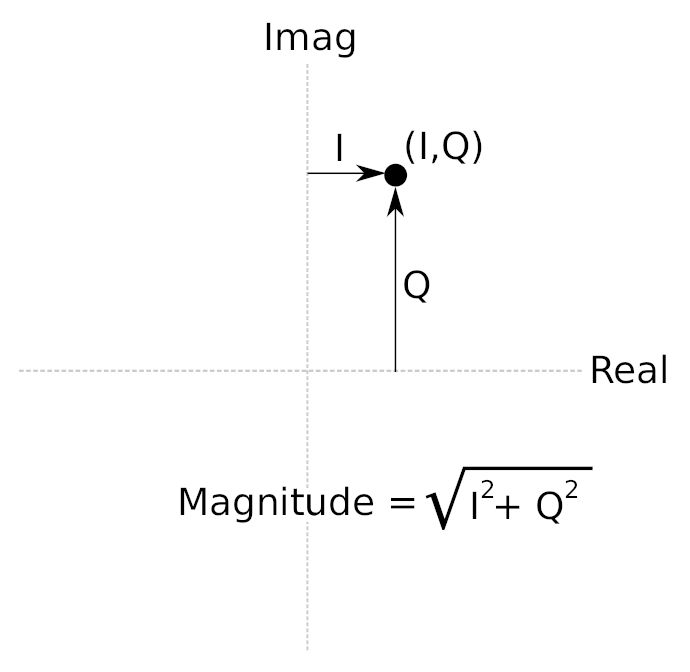
| 17:27, 23 May 2024 | Complex-mag.jpg (file) |  |
19 KB | Diagram showing how the magnitude of a complex sample is calculated. | 1 |
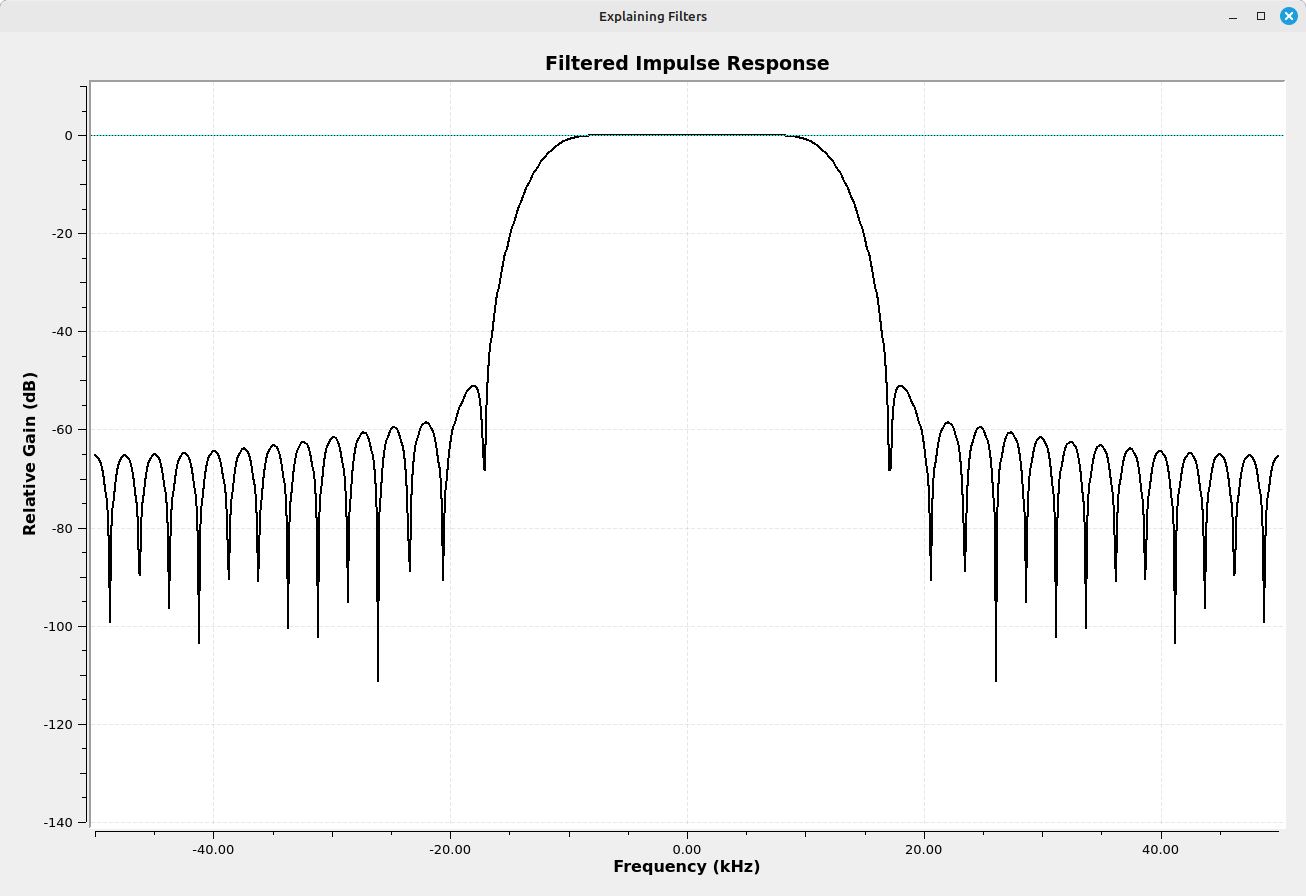
| 00:25, 14 July 2024 | Filter-impulse-response-spectrum.png (file) |  |
37 KB | This is the spectrum of the impulse response of a low pass filter. | 1 |
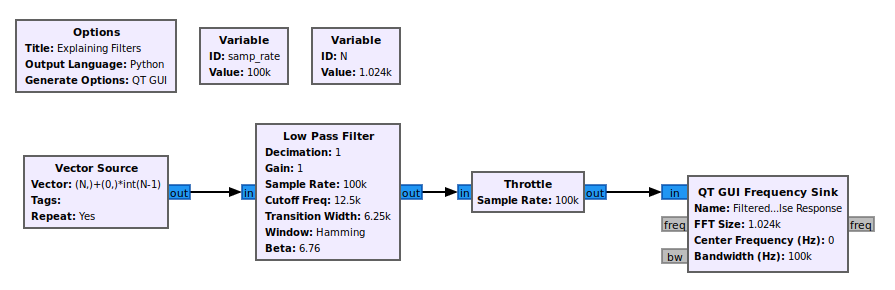
| 00:46, 14 July 2024 | LPF-filter-with-vector-source-flowgraph.png (file) |  |
35 KB | Flowgraph of lowpass filter showing how to display the spectrum of its impulse response. | 1 |
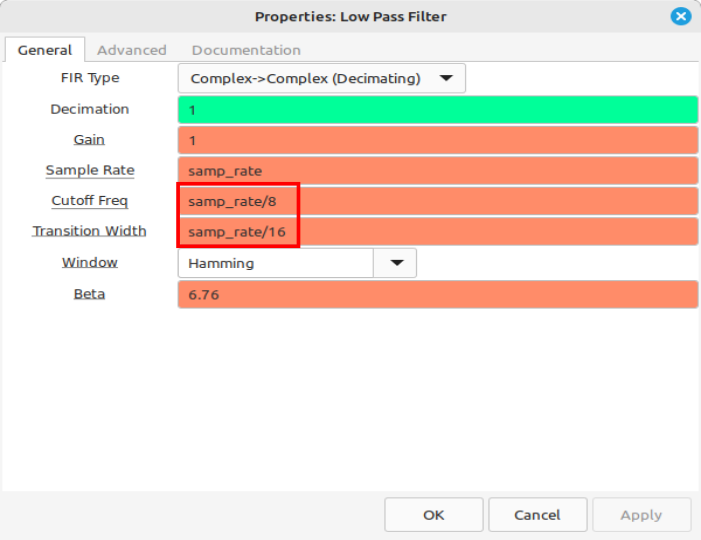
| 01:10, 14 July 2024 | LPF-properties-annotated.png (file) |  |
50 KB | Low pass filter properties for impulse response flowgraph | 1 |
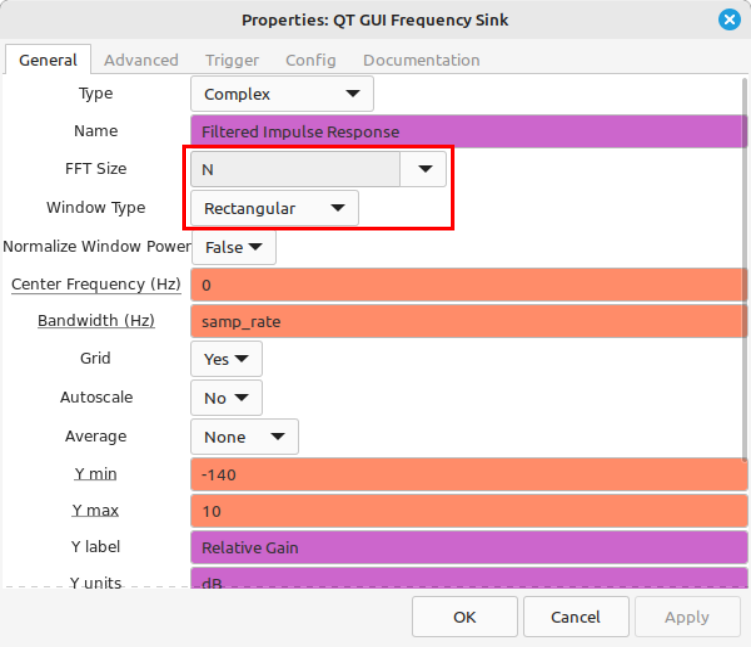
| 01:12, 14 July 2024 | Frequency-sink-properties-annotated.png (file) |  |
85 KB | Properties of frequency sink utilized in impulse response flowgraph | 1 |
| 01:29, 31 December 2024 | Phase-change-constellation-diagram.jpg (file) |  |
24 KB | Constellation diagram showing how frequency modulation will cause consecutive samples to change phase, as frequency is a change of phase over time. | 1 |
| 01:38, 31 December 2024 | Polar-Discriminator-Delay-Conjugate-Method.jpg (file) | 29 KB | Block diagram of polar discriminator. The input complex samples are split. One sample goes straight to a multiplier. The second sample is delayed and conjugated (the imaginary component has its sign flipped), then input to the multiplier. | 1 | |
| 02:03, 31 December 2024 | Polar-discriminator-GRC-block-diagram.png (file) | 48 KB | Gnu Radio Companion equivalent flowgraph of the "Quadrature Demod" block. This is a polar discriminator circuit. The input complex samples are split. One sample is sent to a Multiply block, while the second set are delayed and conjugated before being fed into the Multiply block. The output of the Multiply block will also be complex samples, except they are now the phase difference between consecutive samples. The Complex to Arg block calculates the actual phase, in radians, for each of these... | 1 | |
| 03:12, 31 December 2024 | FM-demod-with-quad-demod-block.png (file) |  |
118 KB | Gnu Radio flowgraph showing FM demodulation of a FM broadcast station (USA) using the Quadrature Demodulation block. | 1 |
| 03:29, 31 December 2024 | Polar-discriminator-output-time-domain.png (file) |  |
107 KB | Vertical axis was corrected. | 2 |
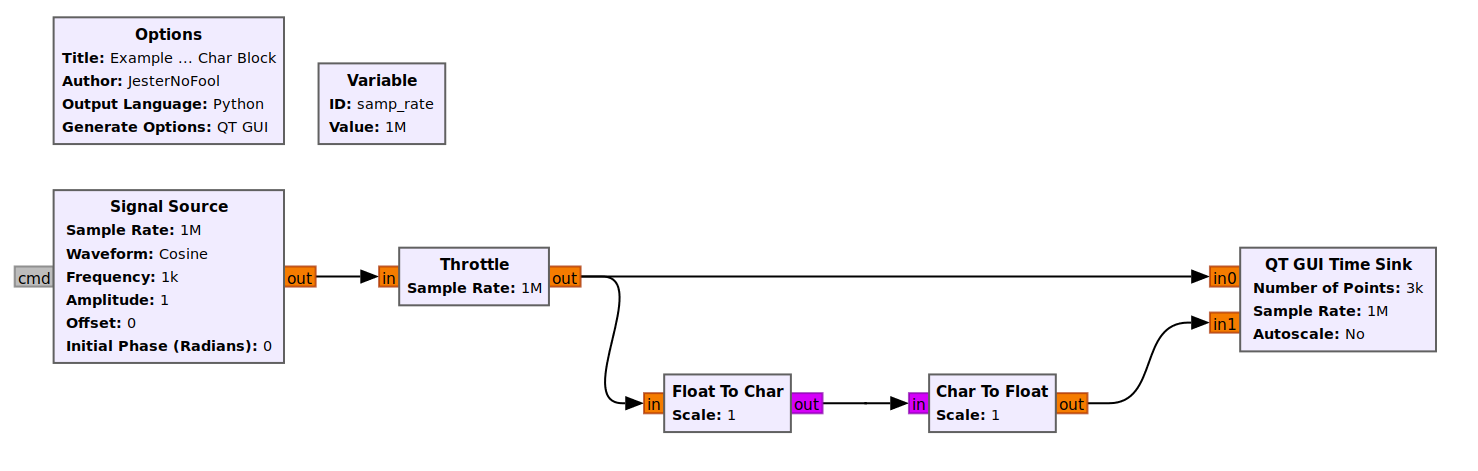
| 01:30, 23 March 2025 | Float-to-Char-flowgraph.png (file) |  |
58 KB | Flowgraph showing an example using the "Float to Char" block. | 1 |
| 01:34, 23 March 2025 | Float-to-Char-scale-1.png (file) |  |
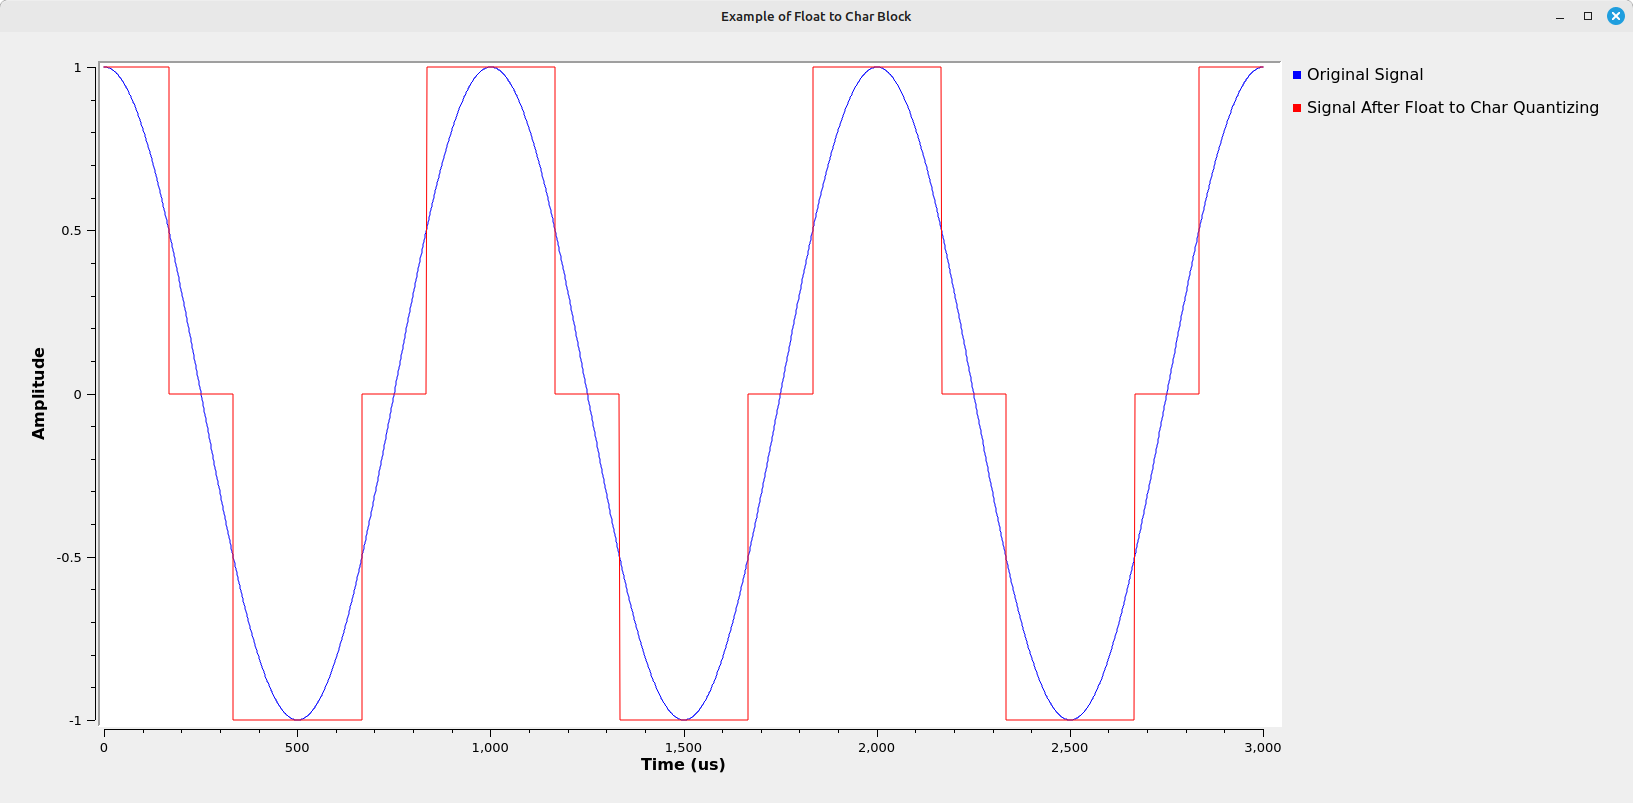
40 KB | Time sink showing a sinusoid created with a 32-bit floating point number (blue) and after going through a "Float to Char" block with a scale of 1 (red). The signal after going through the "Float to Char" has been quantized to integer values of -1, 0 and 1. | 1 |
| 01:47, 23 March 2025 | Float-to-Char-scale-127.png (file) |  |
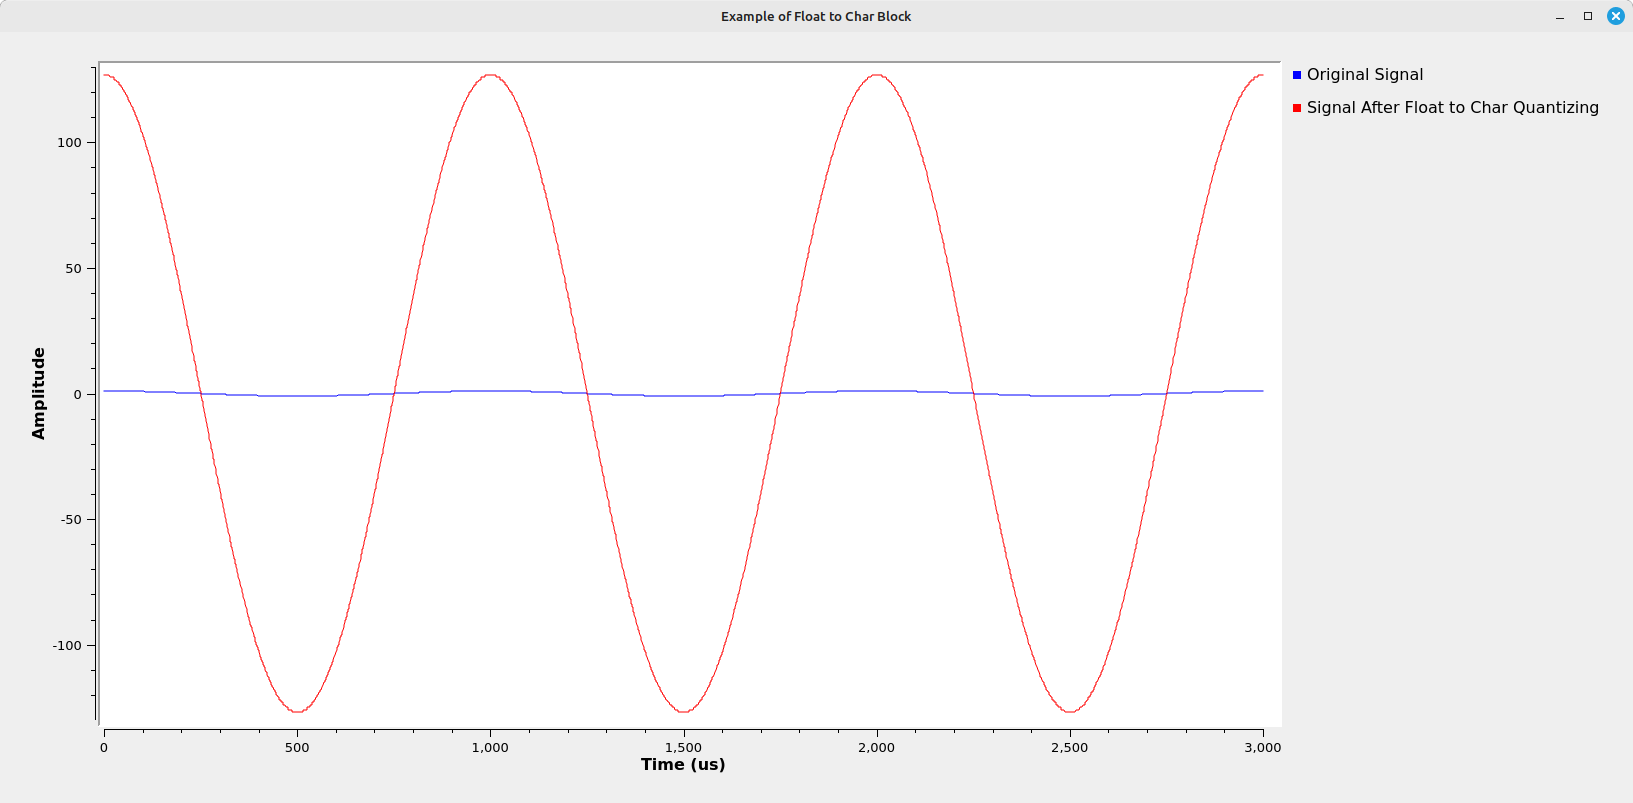
42 KB | A sinusoid with an amplitude of 1 after going through the Float to Char with a 'Scale' value of 127. | 1 |
| 01:52, 23 March 2025 | Float-to-Char-scale-127-1-zoomed.png (file) |  |
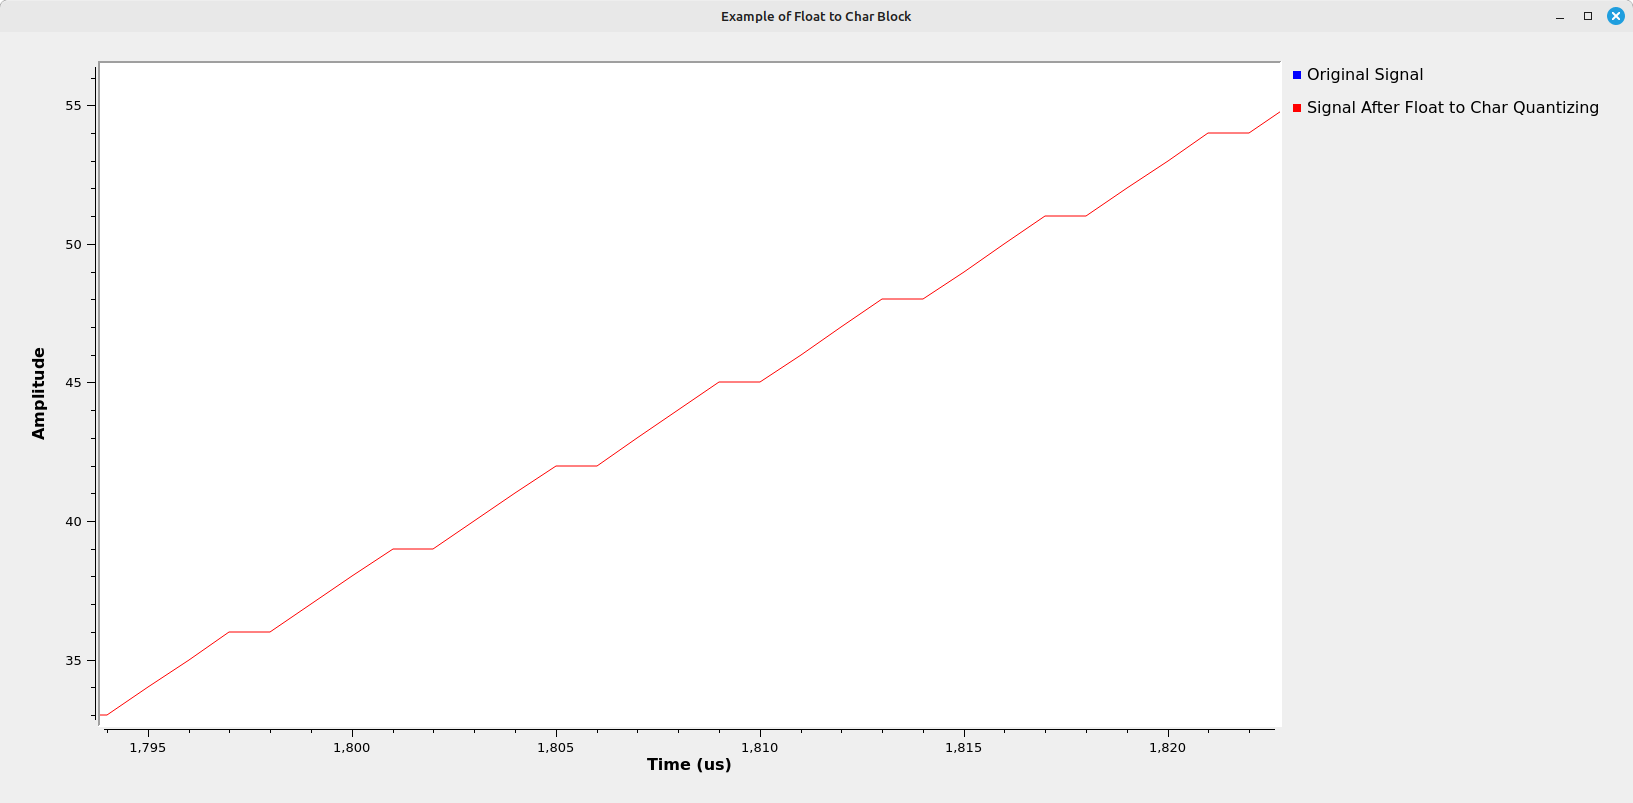
36 KB | Zoomed-in view of sinusoid with an amplitude of 1 after being passed through the 'Float to Char' block with a 'Scale' value of 127. Note that all of the amplitudes have been quantized to integer values. | 1 |
| 01:57, 23 March 2025 | Float-to-Char-scale-150-1.png (file) |  |
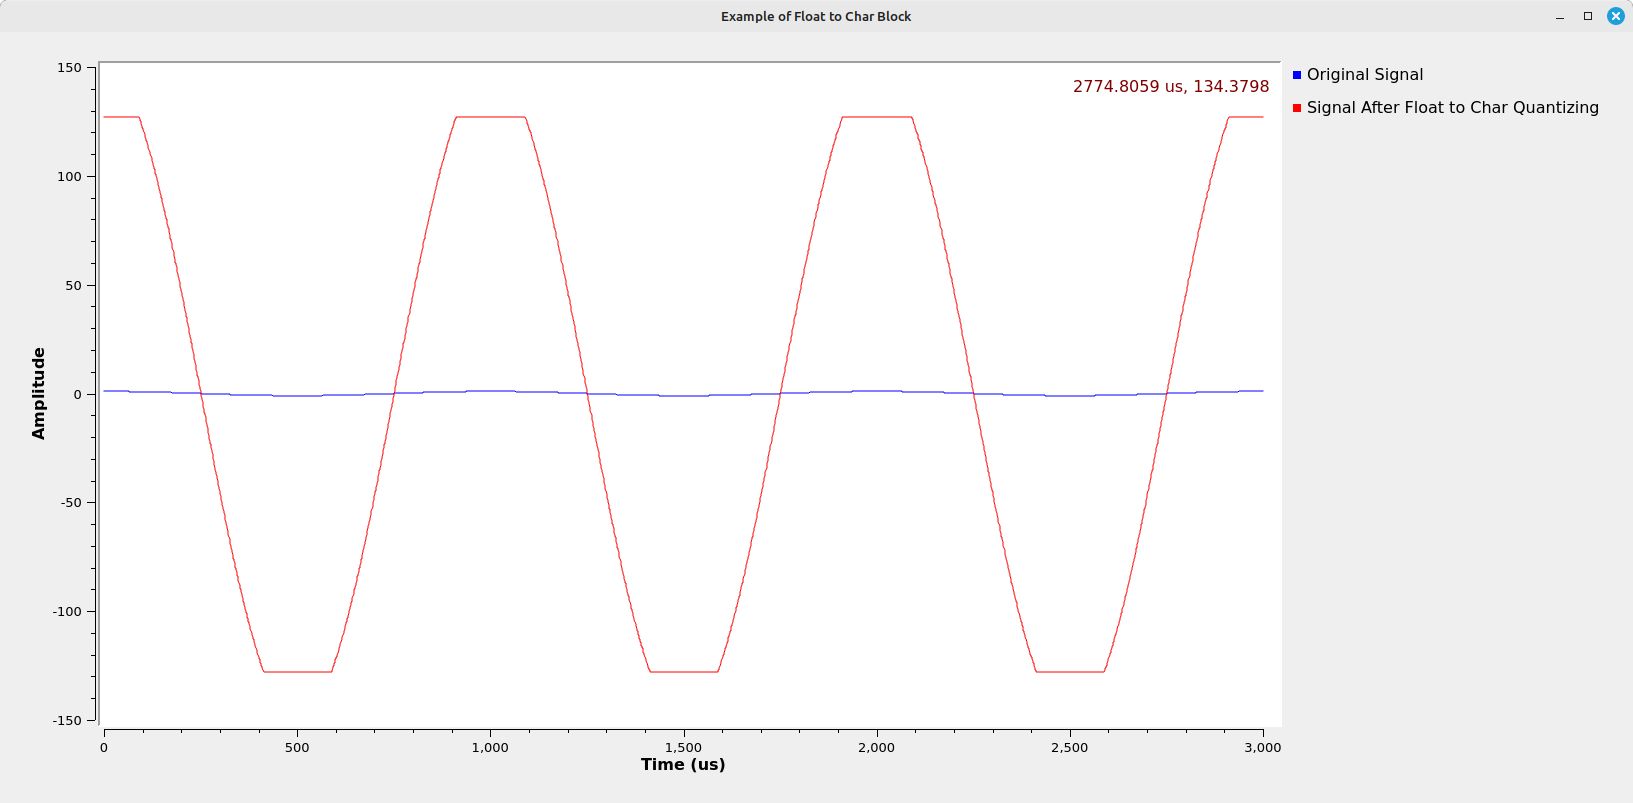
43 KB | Sinusoid with an amplitude of 1 after passing through a 'Float to Char' block with a 'Scale' value of 150. The top and bottom has been clipped to +127 and -128. | 1 |
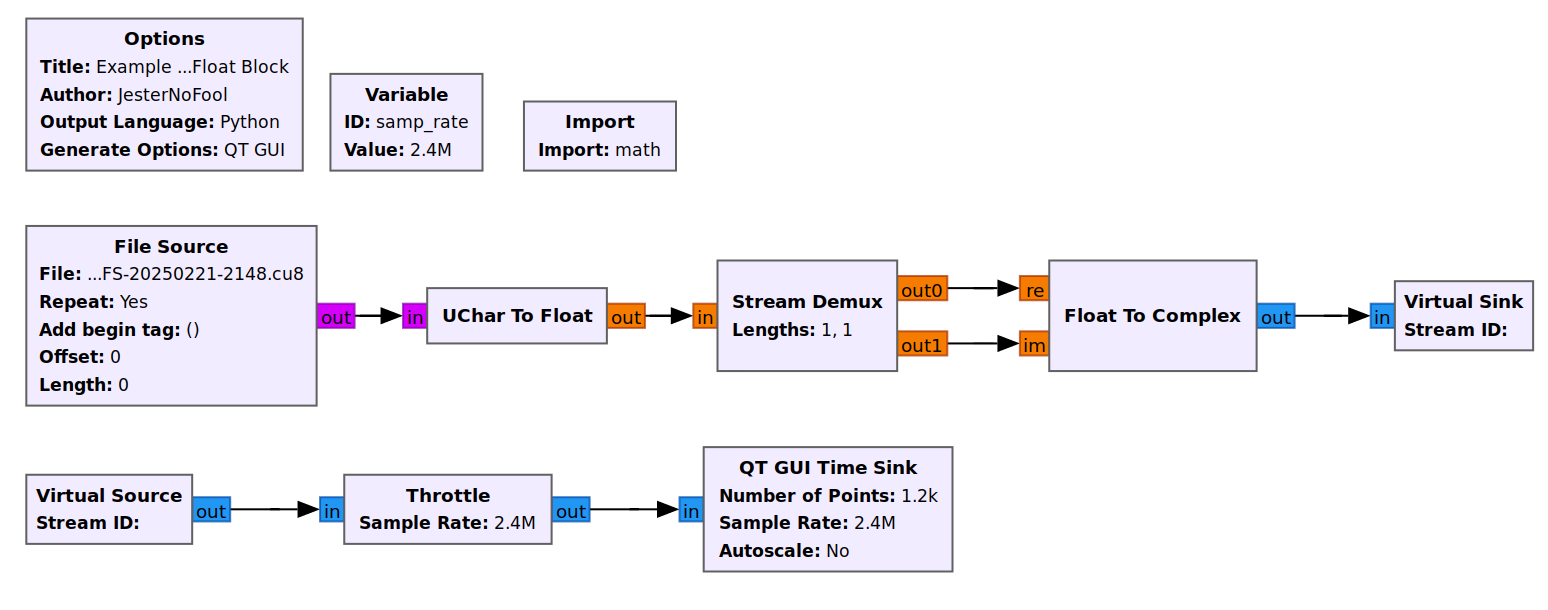
| 02:35, 23 March 2025 | Uchar-to-Float-block-usage-with-RTLSDR-flowgraph.png (file) |  |
78 KB | Flowgraph showing the usage of the 'UChar to Float' block to read the values of a file collected from a RTL-SDR using the "rtl_sdr" command in a terminal. The values so collected are unsigned 8-bit integers. | 1 |
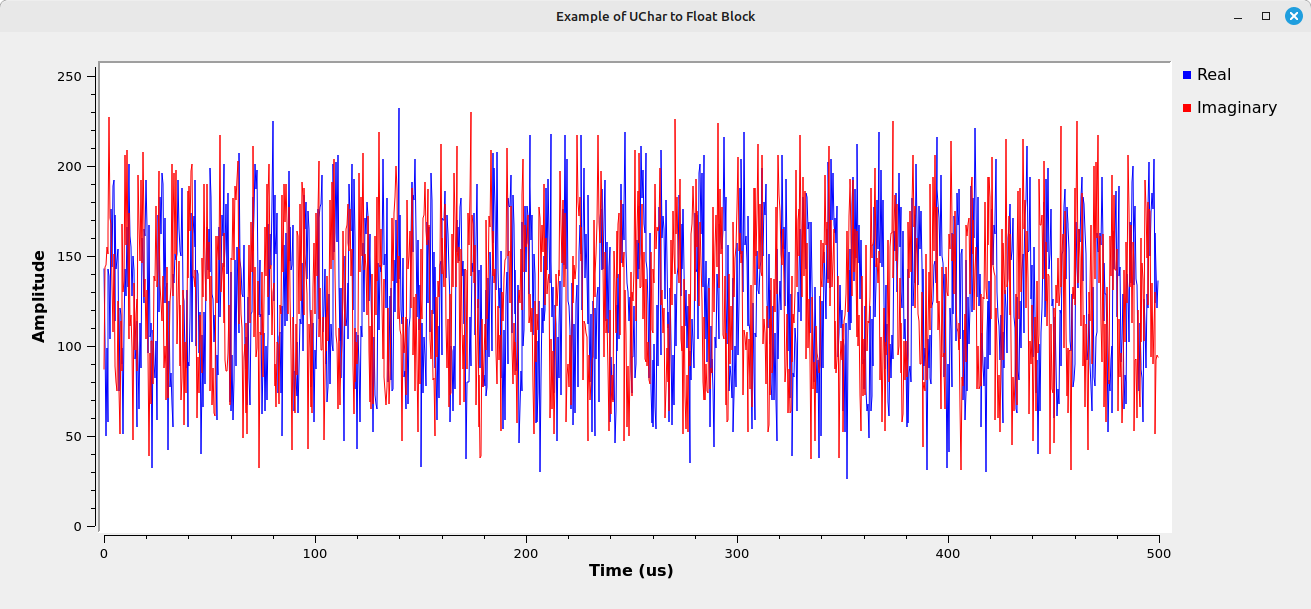
| 02:49, 23 March 2025 | Uchar-to-Float-time-sink-from-RTLSDR-file.png (file) |  |
202 KB | Added proper legend to display | 2 |
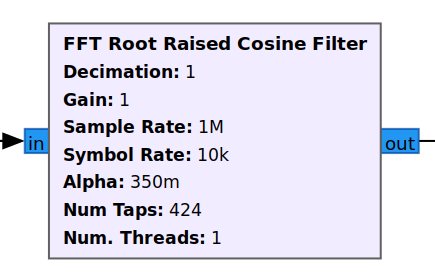
| 16:13, 27 April 2025 | FFT Root Raised Cosine filter-01.png (file) |  |
22 KB | Screenshot of the FFT Root Raised Cosine Filter block. It shows the graphical implementation of this block, which implements a root raised cosine filter using the FFT. | 1 |
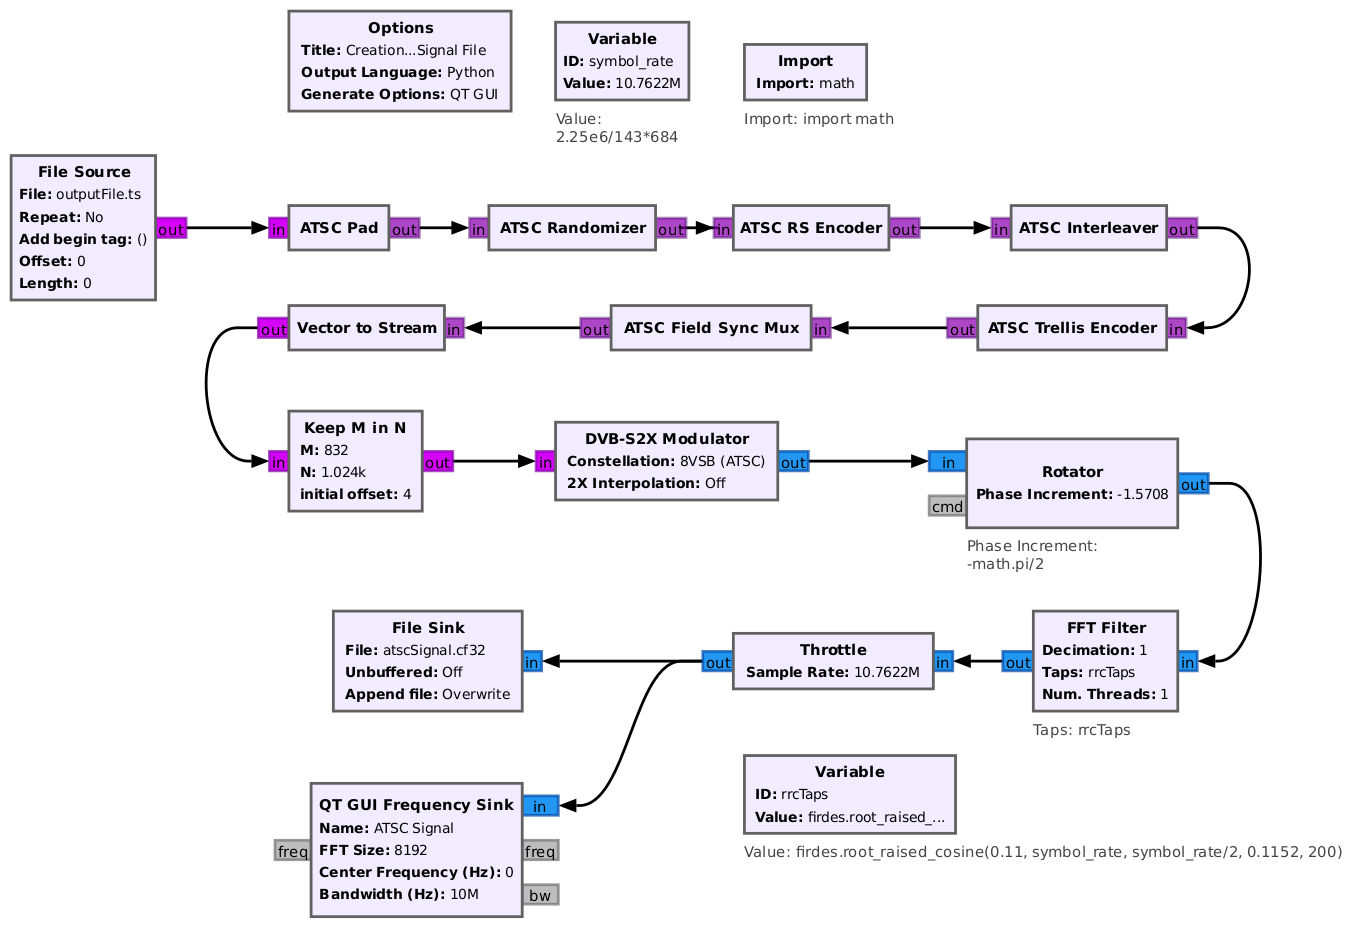
| 02:07, 14 June 2025 | File atsc tx 2.jpg (file) |  |
119 KB | Modified ATSC transmission flowgraph that shows all of the values required in the image. | 1 |
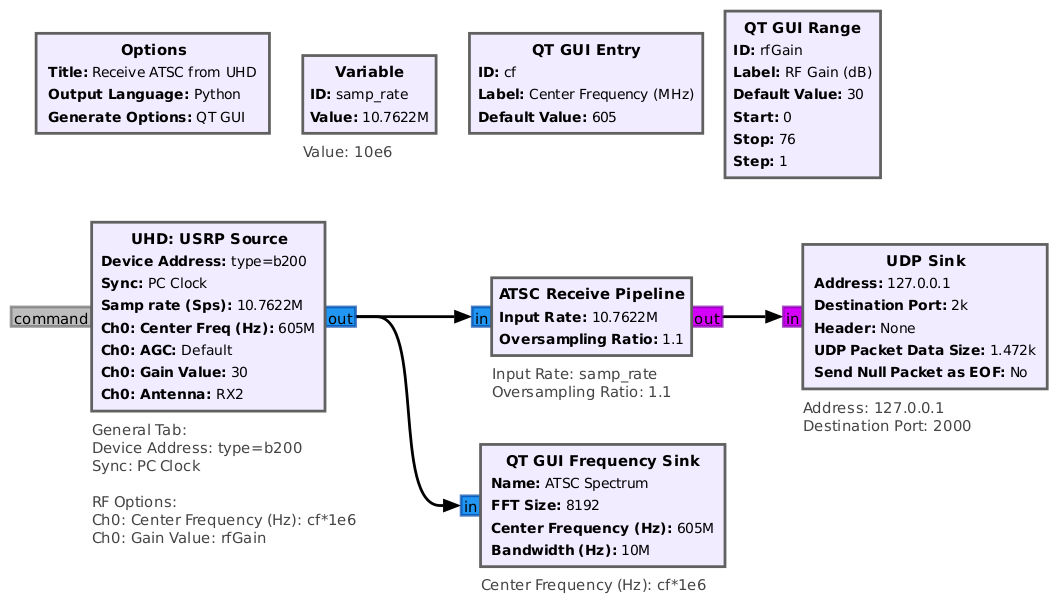
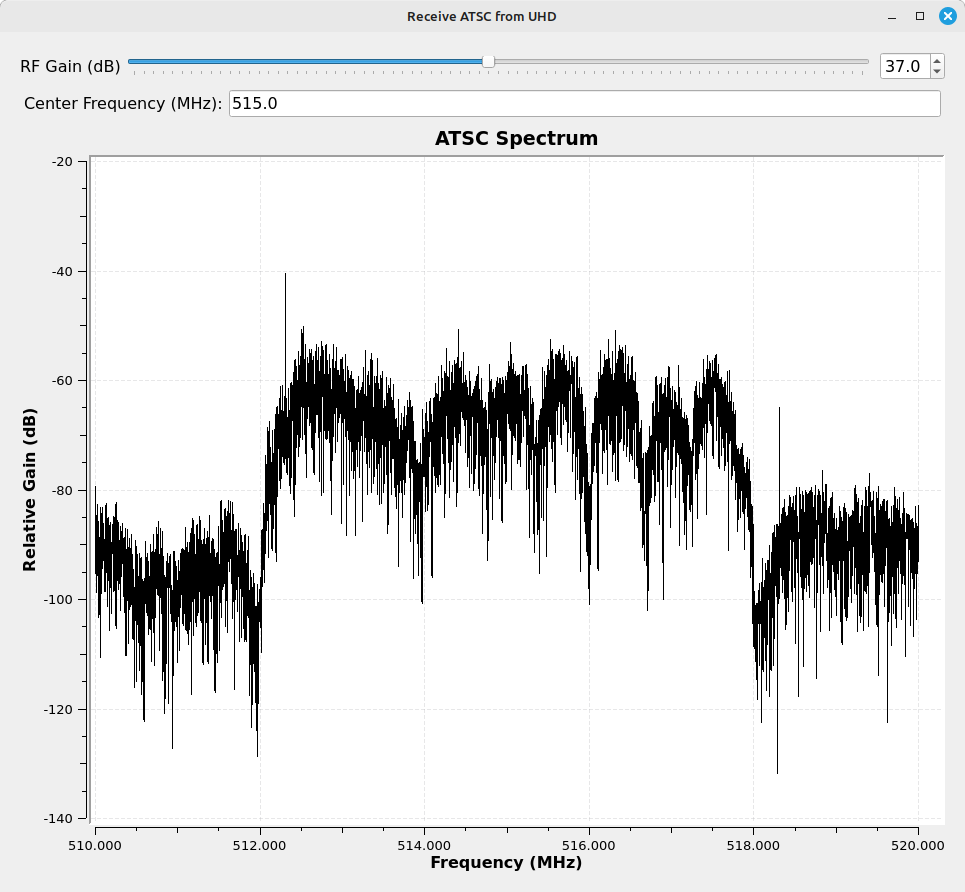
| 14:21, 14 June 2025 | AtscRxFromUHD.jpg (file) |  |
88 KB | Flowgraph using a Ettus Research B200 USRP to receive a ATSC broadcast. | 1 |
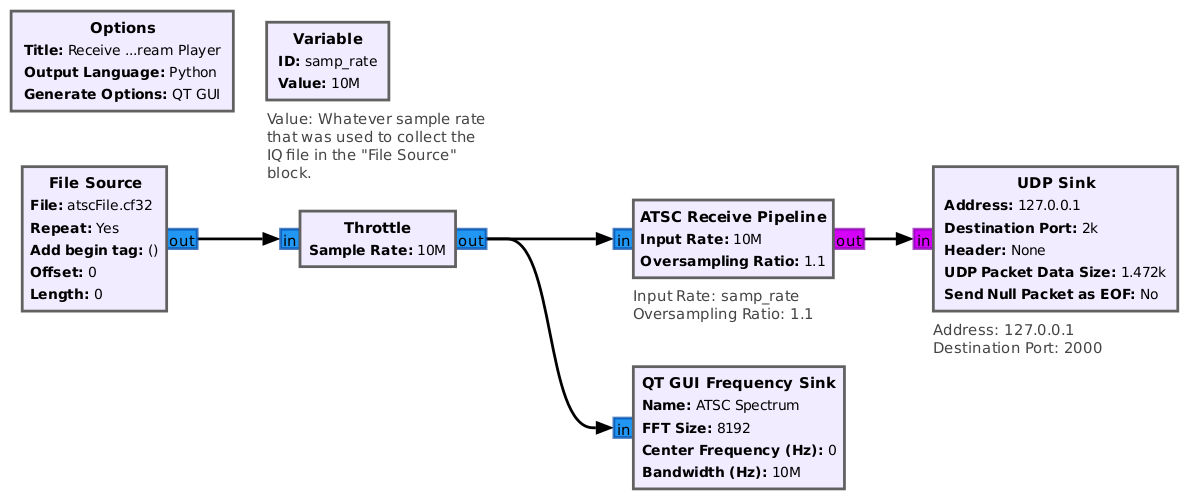
| 14:30, 14 June 2025 | AtscRxWithFile.jpg (file) |  |
67 KB | Added comment to variable for "Sample Rate" | 2 |
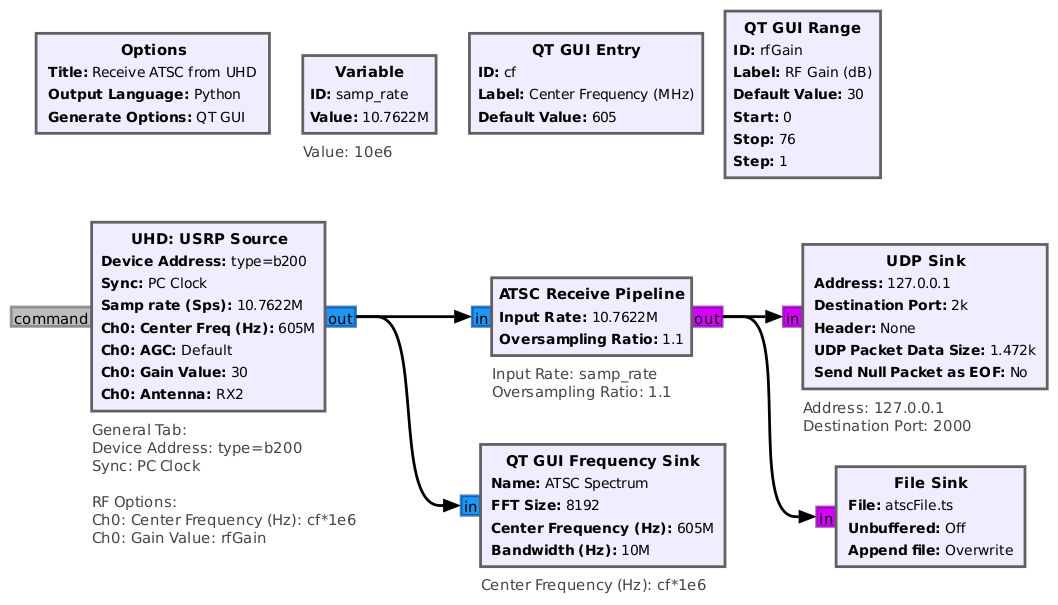
| 14:35, 14 June 2025 | AtscRxFromUHDFileSink.jpg (file) |  |
95 KB | Flowgraph to both receive and record the output of an ATSC signal. | 1 |
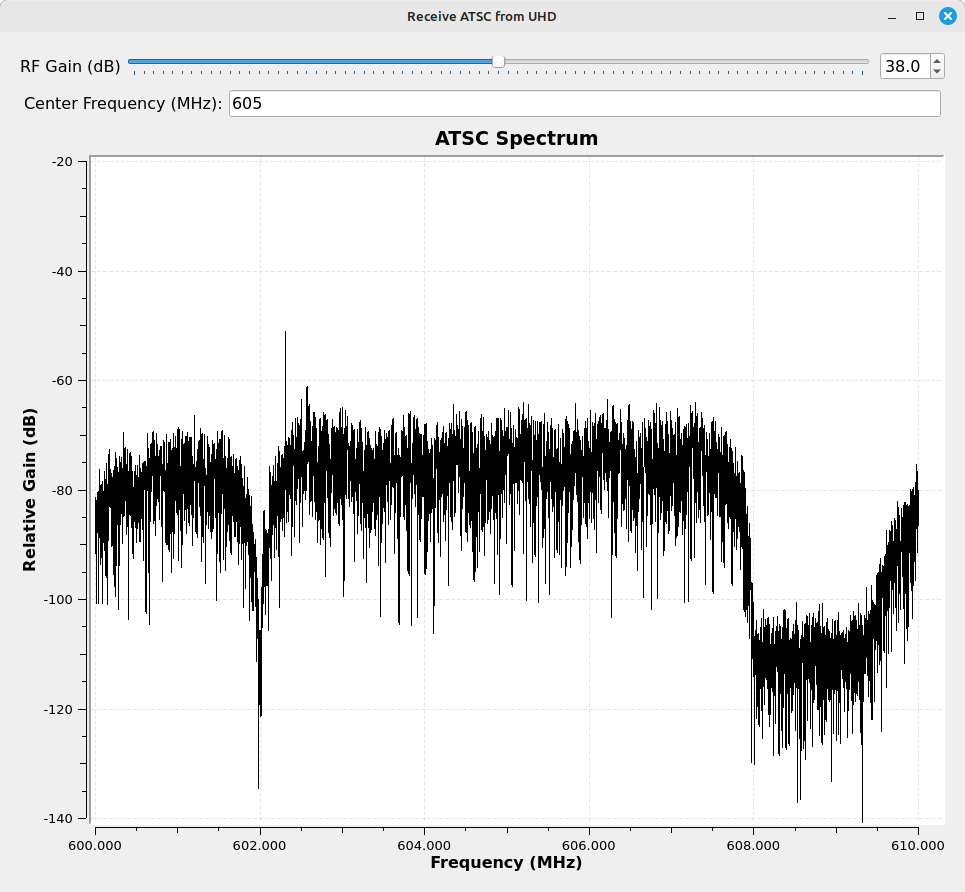
| 01:07, 15 June 2025 | ATSC-signal-good-reception.png (file) |  |
44 KB | An ATSC signal with a flat spectrum. This is necessary in order to recover the contents of the signal using Gnu Radio's ATSC receive blocks. | 1 |
| 01:10, 15 June 2025 | ATSC-with-freq-selective-fading.png (file) |  |
44 KB | ATSC signal with frequency-selective fading. The fading can be seen as the notches in the top of the spectrum of the signal. Such fading creates problems in the recovery of the information. The signal does have a relatively high SNR (signal-to-noise ratio), but the fading makes recovery of the information using Gnu Radio impossible. | 1 |
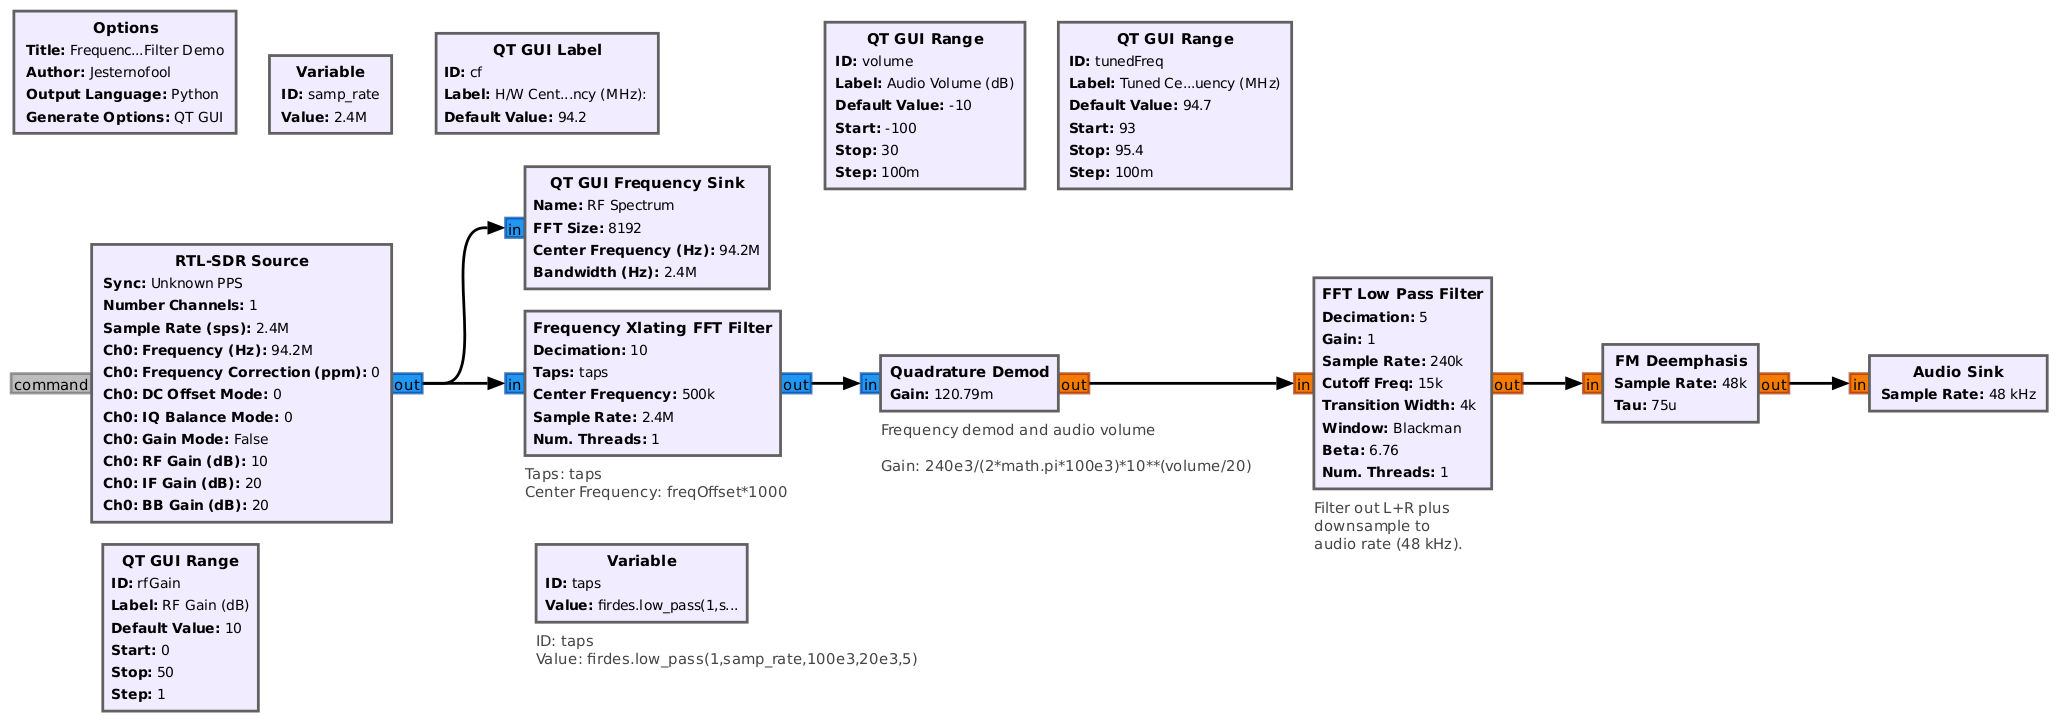
| 18:02, 27 June 2025 | FreqXlatingFftFilterDemo.jpg (file) |  |
148 KB | Flowgraph to demonstrate the Frequency Xlating FFT Filter. | 1 |
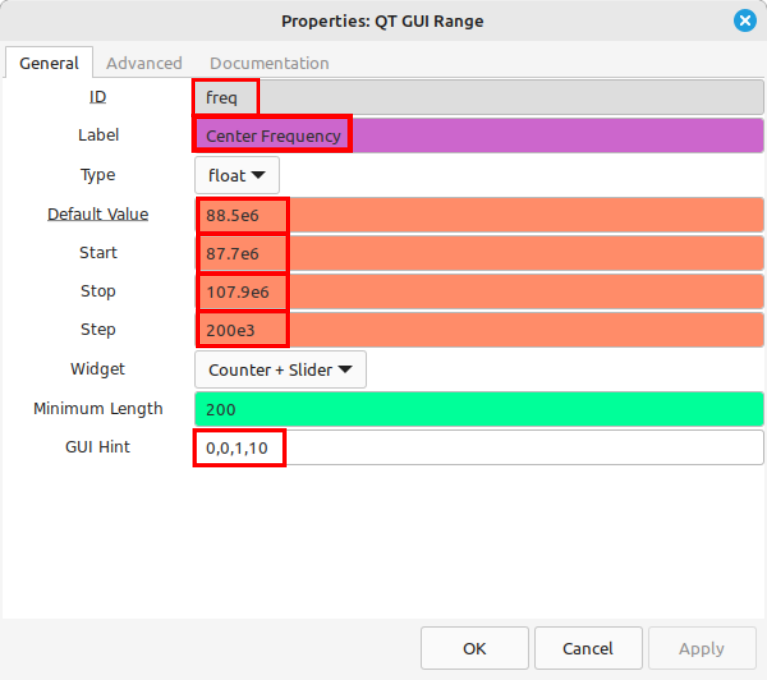
| 02:00, 18 July 2025 | QT-GUI-Range-general-properties-freq-annotated.png (file) |  |
65 KB | This image will be used for the "RTL-SDR FM Receiver" tutorial page. | 1 |
| 02:32, 18 July 2025 | QT-GUI-Range-general-properties-rfGain-annotated.png (file) |  |
59 KB | This image is used in the "RTL-SDR FM Receiver" tutorial. | 1 |
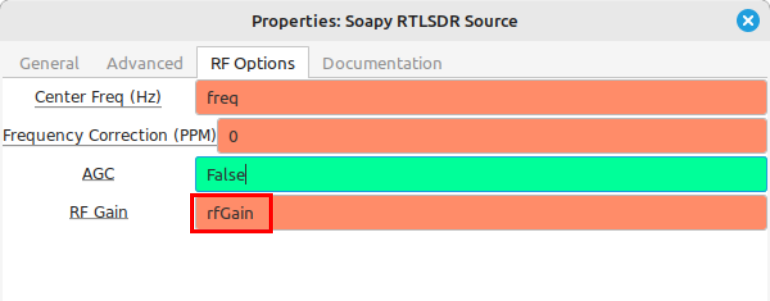
| 02:40, 18 July 2025 | Soapy-RTLSDR-Source-RF-Options-properties-annotated.png (file) |  |
41 KB | This image is used in the "RTL-SDR FM Receiver" tutorial. | 1 |
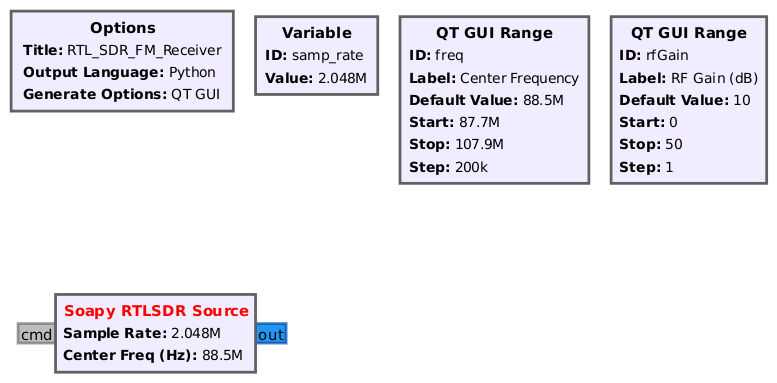
| 02:45, 18 July 2025 | RtlsdrFmReceiverSourceOnly.jpg (file) |  |
39 KB | 1 | |
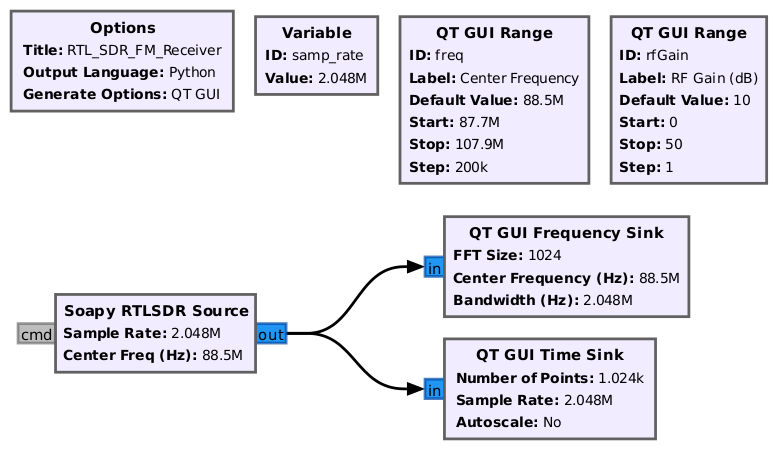
| 02:48, 18 July 2025 | RtlsdrFmReceiverNoDemod.jpg (file) |  |
56 KB | 1 | |
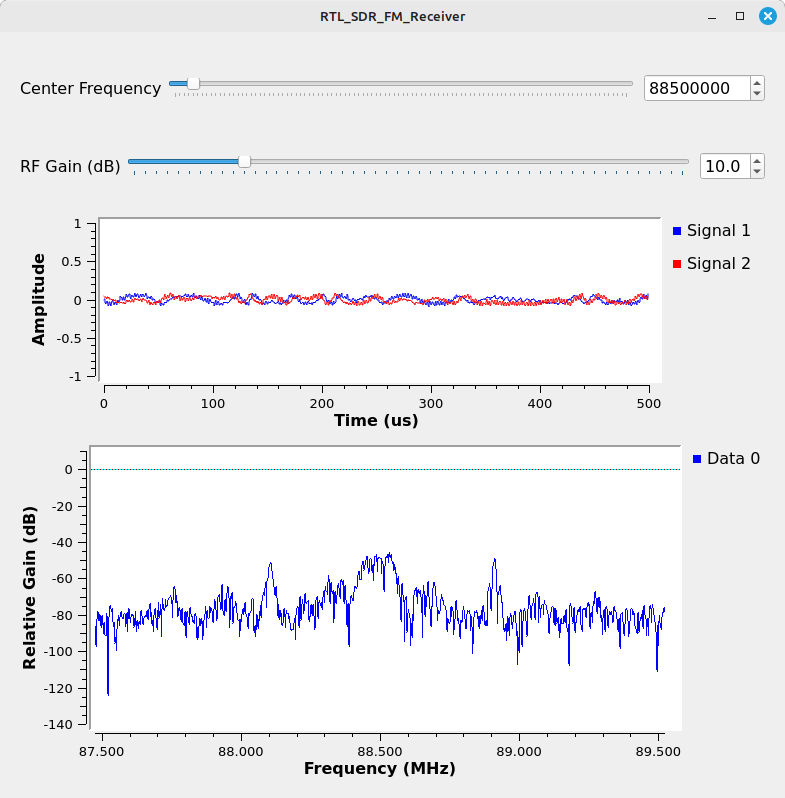
| 02:56, 18 July 2025 | RTL-SDR-FM-Receiver-10-gain.png (file) |  |
49 KB | 1 | |
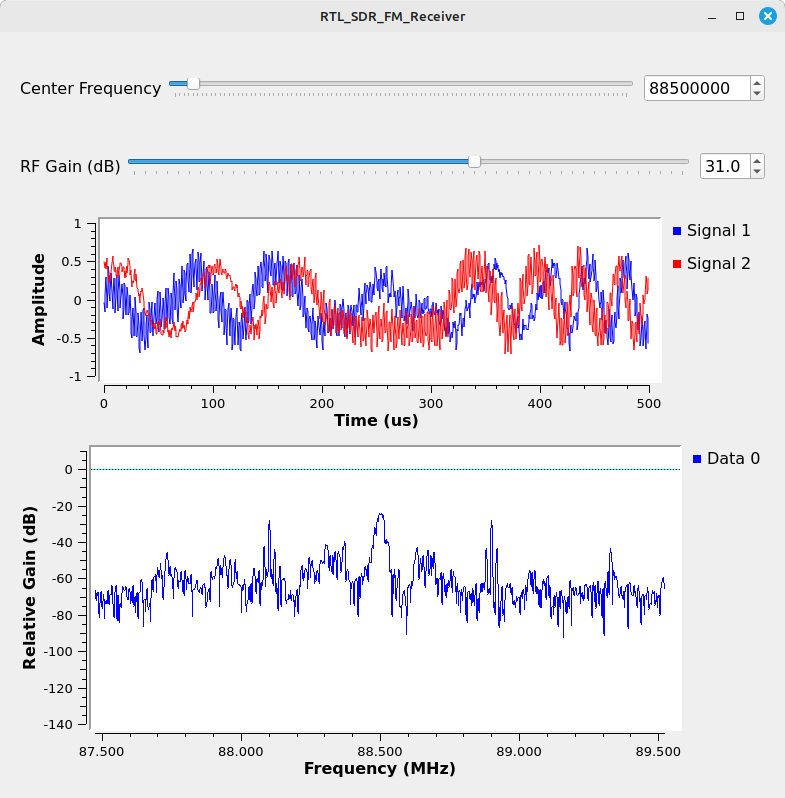
| 03:02, 18 July 2025 | RTL-SDR-FM-Receiver-31-gain.png (file) |  |
78 KB | 1 | |
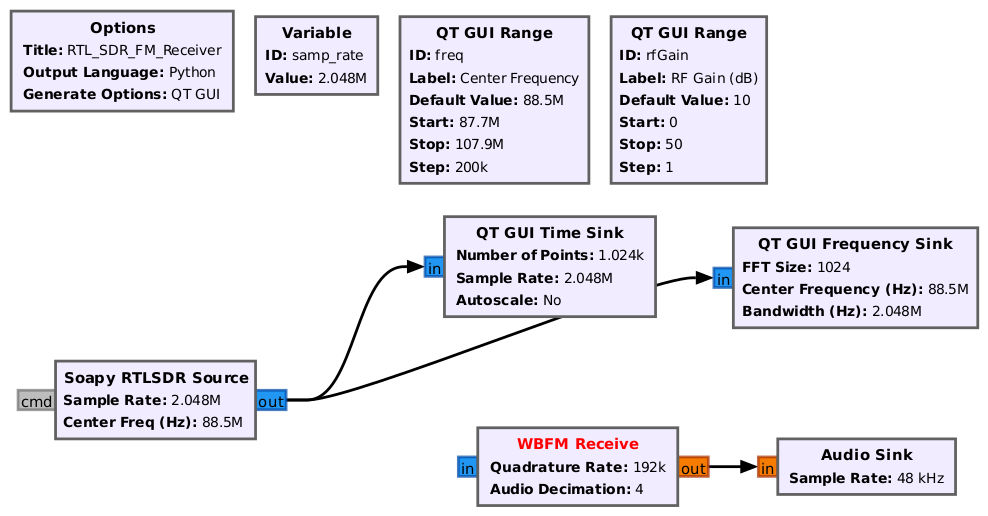
| 23:31, 18 July 2025 | RTL-SDR-FM-receiver-no-rational-resampler.jpg (file) |  |
69 KB | This image is used in the "RTL-SDR FM Receiver" tutorial. | 1 |
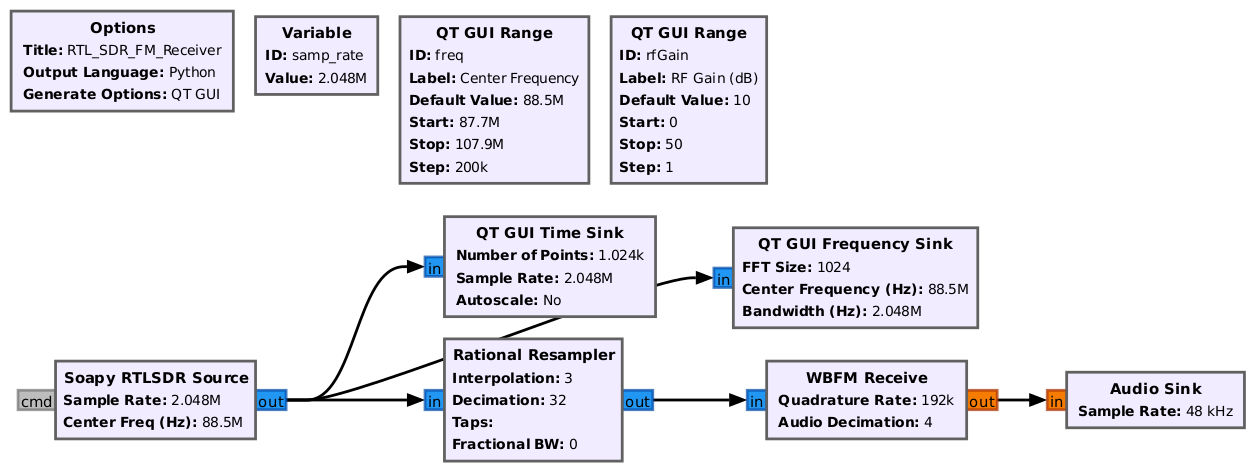
| 23:34, 18 July 2025 | RTL-SDR-FM-Receiver-original.jpg (file) |  |
77 KB | This image is used in the "RTL-SDR FM Receiver" tutorial. | 1 |
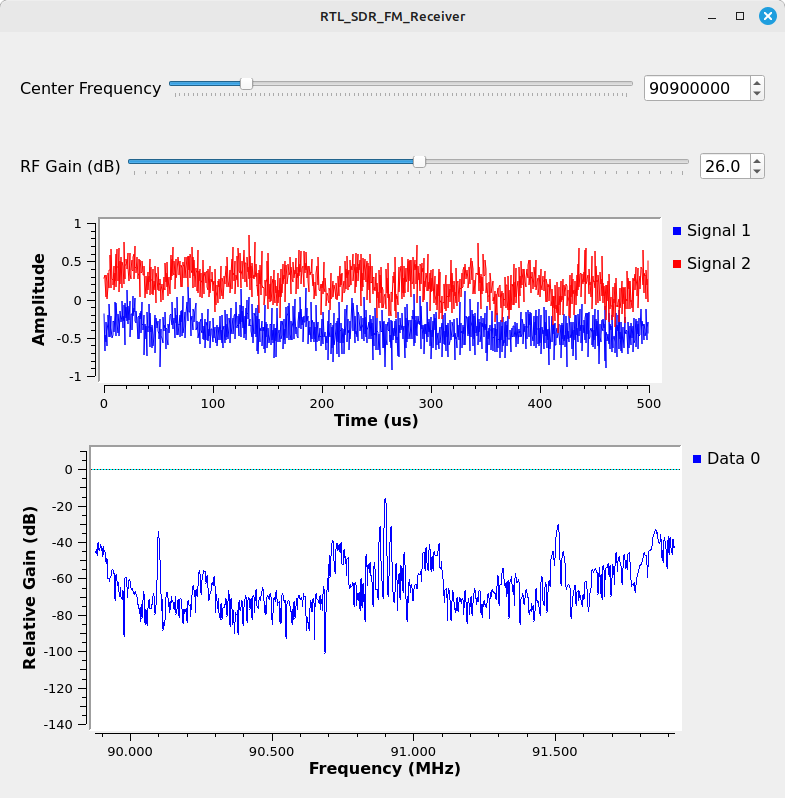
| 23:59, 18 July 2025 | RTL-SDR-FM-Receiver-90M9CF.png (file) |  |
85 KB | This image is used in the "RTL-SDR FM Receiver" tutorial. | 1 |
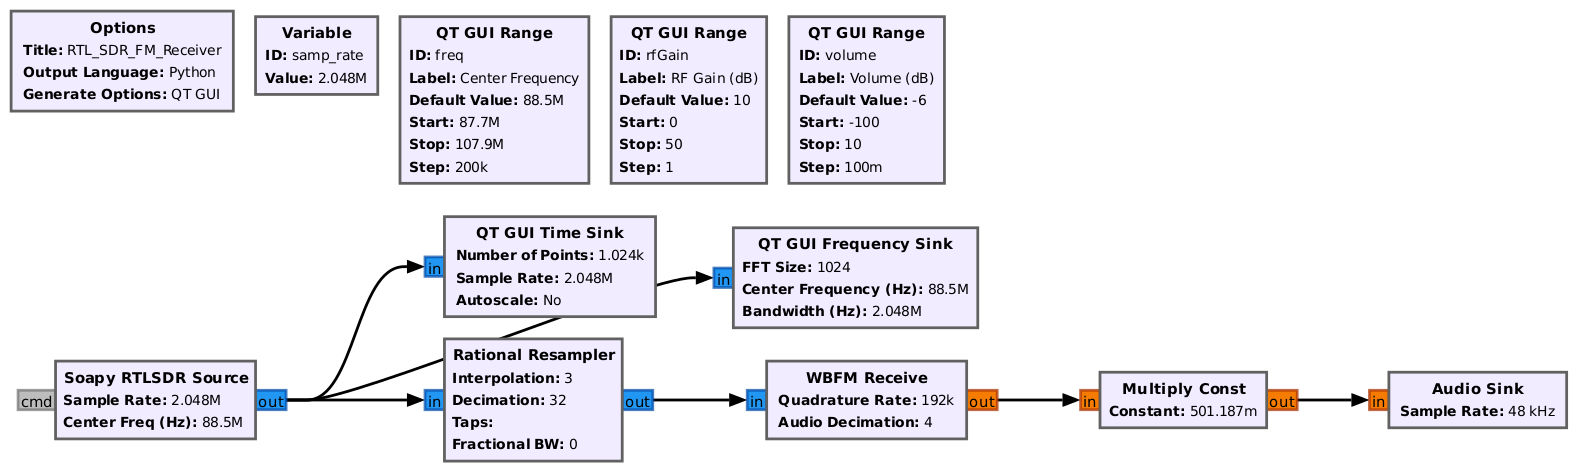
| 00:11, 19 July 2025 | RTL-SDR-FM-Receiver-with-volume-control.jpg (file) |  |
91 KB | This image is used in the "RTL-SDR FM Receiver" tutorial. | 1 |