QT GUI Time Sink: Difference between revisions
No edit summary |
mNo edit summary |
||
| (13 intermediate revisions by 3 users not shown) | |||
| Line 4: | Line 4: | ||
This block does not support C++ output, so it cannot be used when the output language of a flowgraph in GRC is C++. | This block does not support C++ output, so it cannot be used when the output language of a flowgraph in GRC is C++. | ||
This is a QT-based graphical sink | This is a QT-based graphical sink that takes sets of float or complex streams and plots them in the time domain. Each signal is plotted with a different color, and options of the block can be used to change the label and color for a given input number. | ||
The sink supports plotting streaming float data or messages. The message port is named "in". The two modes cannot be used simultaneously, and | The sink supports plotting streaming float data, complex data or messages. The message port is named "in". The two modes cannot be used simultaneously, and should be set to 0 when using the message mode. GRC handles this issue by providing the "Float Message" type that removes the streaming port(s). | ||
There are many parameters, across three different tabs, most of which are self-explanatory. | There are many parameters, across three different tabs of General, Trigger and Config, most of which are self-explanatory. | ||
== Parameters == | |||
<b>(''R''):</b> <span class="plainlinks">[https://wiki.gnuradio.org/index.php/GNURadioCompanion#Variable_Controls ''Run-time adjustable'']</span> | |||
=== General === | |||
; Type | |||
:* Complex | |||
:* Float | |||
:* Complex Message | |||
:* Float Message | |||
; Name | |||
: The name of the plot. It is shown on the top of the plot in the output window. | |||
; Y Axis Label | |||
: The Y Axis Label to be added to the plot. The x-axis label is 'Time', which is added automatically to the plot. | |||
; Y Axis Unit | |||
: The unit of data to be shown infront of the Y Axis Label. It is shown in round brackets. | |||
; Number of Points | |||
: This number determines how many points in the X-axis will be displayed. Since the X-axis is milliseconds, the range of the x-axis will be the product (Number of Points)*(samp_rate). For example if your 'samp_rate' is 48000 and you use 48000 for 'Number of Points' the X axis will go from 0 to 1 sec. | |||
; Grid | |||
; Update Period | :* Yes: Adds a grid to the plot | ||
:* No: No grid added to the plot | |||
; Autoscale | |||
:* Yes: Automatically adjust the maximum and minimum y axis values of the plot to contain the entire plot along y axis. Choosing this option overrides the values specified in Y min and Y max input parameters. | |||
:* No: Does not automatically adjust the plot. The values of Y min and Y max are used to create the plot. | |||
; Y min (''R'') | |||
: The minimum y axis value to be automatically shown in the plot | |||
; Y max (''R'') | |||
: The maximum y axis value to be automatically shown in the plot | |||
; Number of Inputs | |||
: Total number of input ports to be created on this block | |||
; Update Period (''R'') | |||
: The period after which the plot data will be updated | : The period after which the plot data will be updated | ||
; Disp. Tags | |||
:* Yes: Display the tags in the plot | |||
:* No: Do not display the tags in the plot | |||
; GUI Hint | |||
: This parameter controls the placement of the plot in the output window. See [[GUI Hint]] for info about how to organize multiple QT GUIs. | |||
== Example Flowgraph == | == Example Flowgraph == | ||
| Line 23: | Line 67: | ||
Qt GUI Time Sink showing its control panel, with trigger settings. | Qt GUI Time Sink showing its control panel, with trigger settings. | ||
[[File:Timesink-ctrl-large.jpg|600px]] | |||
[[File:Timesink-ctrl- | |||
== Source Files == | == Source Files == | ||
Latest revision as of 16:42, 15 May 2024
A graphical sink to display multiple signals in time.
This block does not support C++ output, so it cannot be used when the output language of a flowgraph in GRC is C++.
This is a QT-based graphical sink that takes sets of float or complex streams and plots them in the time domain. Each signal is plotted with a different color, and options of the block can be used to change the label and color for a given input number.
The sink supports plotting streaming float data, complex data or messages. The message port is named "in". The two modes cannot be used simultaneously, and should be set to 0 when using the message mode. GRC handles this issue by providing the "Float Message" type that removes the streaming port(s).
There are many parameters, across three different tabs of General, Trigger and Config, most of which are self-explanatory.
Parameters
(R): Run-time adjustable
General
- Type
-
- Complex
- Float
- Complex Message
- Float Message
- Name
- The name of the plot. It is shown on the top of the plot in the output window.
- Y Axis Label
- The Y Axis Label to be added to the plot. The x-axis label is 'Time', which is added automatically to the plot.
- Y Axis Unit
- The unit of data to be shown infront of the Y Axis Label. It is shown in round brackets.
- Number of Points
- This number determines how many points in the X-axis will be displayed. Since the X-axis is milliseconds, the range of the x-axis will be the product (Number of Points)*(samp_rate). For example if your 'samp_rate' is 48000 and you use 48000 for 'Number of Points' the X axis will go from 0 to 1 sec.
- Grid
-
- Yes: Adds a grid to the plot
- No: No grid added to the plot
- Autoscale
-
- Yes: Automatically adjust the maximum and minimum y axis values of the plot to contain the entire plot along y axis. Choosing this option overrides the values specified in Y min and Y max input parameters.
- No: Does not automatically adjust the plot. The values of Y min and Y max are used to create the plot.
- Y min (R)
- The minimum y axis value to be automatically shown in the plot
- Y max (R)
- The maximum y axis value to be automatically shown in the plot
- Number of Inputs
- Total number of input ports to be created on this block
- Update Period (R)
- The period after which the plot data will be updated
- Disp. Tags
-
- Yes: Display the tags in the plot
- No: Do not display the tags in the plot
- GUI Hint
- This parameter controls the placement of the plot in the output window. See GUI Hint for info about how to organize multiple QT GUIs.
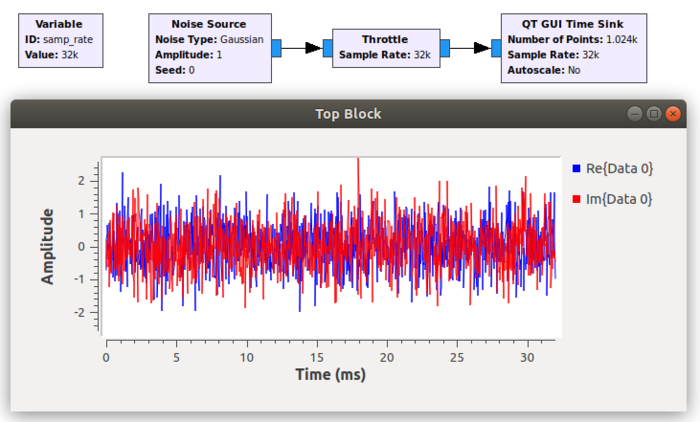
Example Flowgraph
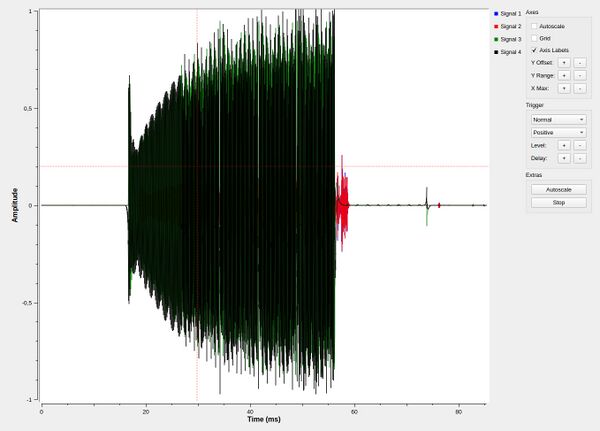
Control Panel & Triggering
Qt GUI Time Sink showing its control panel, with trigger settings.
Source Files
- Header files
- time_sink_complex_impl.h
- time_sink_float_impl.h
- Public header files
- time_sink_complex.h
- time_sink_float.h
- Block definition
- qtgui_time_sink_x.block.yml

