File:Log Power FFT, 913 x 278.png: Difference between revisions
(This summary describes how to create a flowgraph in GNU Radio Companion (GRC) using the Log Power FFT block to process a sine wave signal and visualize its logarithmic power spectrum. The setup is straightforward, and the output aligns with the expected behavior of the block as described. Flowgraph Components and Configuration. Signal Source Generates a sine wave. Frequency: 1 kHz. Sample Rate: 32,000 samples per second (32 kHz). Amplitude: 1 (a simple, clean input signal). Throttle Block...) |
No edit summary |
||
| Line 1: | Line 1: | ||
== Summary == | == Summary == | ||
Flowgraph Components and Configuration. | Flowgraph Components and Configuration. | ||
Revision as of 17:06, 14 April 2025
Summary
Flowgraph Components and Configuration.
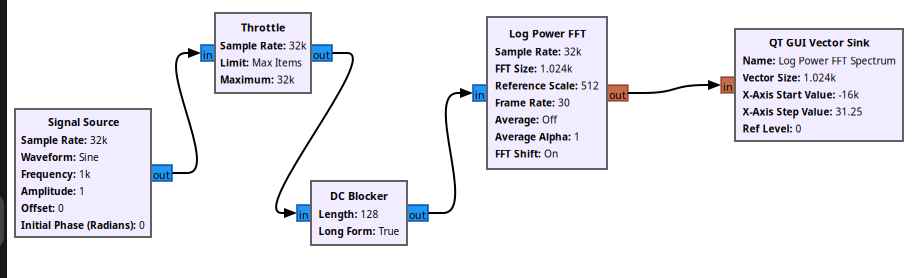
Signal Source Generates a sine wave. Frequency: 1 kHz. Sample Rate: 32,000 samples per second (32 kHz). Amplitude: 1 (a simple, clean input signal).
Throttle Block
Matches the sample rate of the signal source at 32,000 sps.
Ensures data flows at the correct rate for real-time visualization.
Log Power FFT Block Computes the logarithmic power spectrum of the input signal. FFT Size: 1024 (number of frequency bins). Reference Scale: 512 (sets the sine wave peak at 0 dB). FFT Shift: Enabled (centers the spectrum, placing 0 Hz in the middle). Frame Rate: 30 (updates the display 30 times per second). Averaging: Disabled (shows instantaneous spectrum).
QT GUI Vector Sink
Visualizes the output spectrum.
X-Axis Start: -16,000 Hz (half the sample rate).
Step Value: 31.25 Hz (sample rate / FFT size).
Displays frequencies from -16,000 Hz to +16,000 Hz due to FFT Shift
File history
Click on a date/time to view the file as it appeared at that time.
| Date/Time | Thumbnail | Dimensions | User | Comment | |
|---|---|---|---|---|---|
| current | 17:01, 14 April 2025 | 913 × 278 (54 KB) | OnlyDPCanSaveMe (talk | contribs) | This summary describes how to create a flowgraph in GNU Radio Companion (GRC) using the Log Power FFT block to process a sine wave signal and visualize its logarithmic power spectrum. The setup is straightforward, and the output aligns with the expected behavior of the block as described. Flowgraph Components and Configuration. Signal Source Generates a sine wave. Frequency: 1 kHz. Sample Rate: 32,000 samples per second (32 kHz). Amplitude: 1 (a simple, clean input signal). Throttle Block... |
You cannot overwrite this file.
File usage
The following page uses this file: