Variables in Flowgraphs: Difference between revisions
Mattcarrick (talk | contribs) No edit summary |
Mattcarrick (talk | contribs) No edit summary |
||
| Line 4: | Line 4: | ||
=='''Variables'''== | =='''Variables'''== | ||
A GNURadio flowgraph is a ''.py'' Python file. Just as Python can have variables | A GNURadio flowgraph is a ''.py'' Python file. Just as Python code can have variables so too can a GNURadio flowgraph by using the ''Variable'' block. | ||
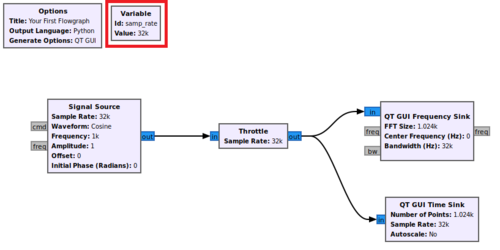
Every new flowgraph starts with the ''samp_rate'' variable: | |||
[[File:VariableSampRate.png|500px]] | |||
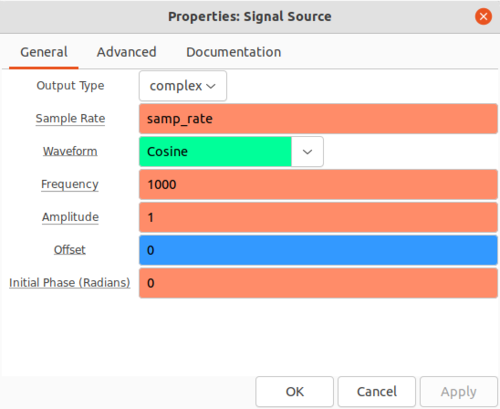
GNURadio blocks are implemented as functions and can take parameters which modify their behavior. All of the blocks in the flowgraph above use ''samp_rate'' as a parameter. Double-click the ''Signal Source'' block to view and modify it's parameters: | |||
[[File:SignalSourceProperties.png|500px]] | |||
You'll notice that ''samp_rate'' is the variable being used for the Sample Rate but Frequency is hard coded to 1000. | |||
TODO: | |||
make/edit variables | make/edit variables | ||
complex vs float (blue vs orange) | complex vs float (blue vs orange) | ||
compare the python .py code with the visual GRC flowgraph | |||
Revision as of 18:21, 3 January 2022
This page describes the fundamentals of a flowgraph: how to make and edit variables, and data types. The flowgraph from the previous guide (Your First Flowgraph) will be used as a reference.
Variables
A GNURadio flowgraph is a .py Python file. Just as Python code can have variables so too can a GNURadio flowgraph by using the Variable block.
Every new flowgraph starts with the samp_rate variable:
GNURadio blocks are implemented as functions and can take parameters which modify their behavior. All of the blocks in the flowgraph above use samp_rate as a parameter. Double-click the Signal Source block to view and modify it's parameters:
You'll notice that samp_rate is the variable being used for the Sample Rate but Frequency is hard coded to 1000.
TODO: make/edit variables complex vs float (blue vs orange) compare the python .py code with the visual GRC flowgraph

