Variables in Flowgraphs: Difference between revisions
Mattcarrick (talk | contribs) No edit summary |
Mattcarrick (talk | contribs) No edit summary |
||
| Line 1: | Line 1: | ||
{{Template:TutorialNavigation}} | {{Template:TutorialNavigation}} | ||
This tutorial describes how to use variables in a flowgraph. The flowgraph from the previous guide ([[Your_First_Flowgraph|Your First Flowgraph]]) will be used as a starting point for this | This tutorial describes how to use variables in a flowgraph. The flowgraph from the previous guide ([[Your_First_Flowgraph|Your First Flowgraph]]) will be used as a starting point for this tutorial, so please complete it beforehand. | ||
==Basic Variables== | ==Basic Variables== | ||
Revision as of 21:44, 11 January 2022
This tutorial describes how to use variables in a flowgraph. The flowgraph from the previous guide (Your First Flowgraph) will be used as a starting point for this tutorial, so please complete it beforehand.
Basic Variables
A GNURadio flowgraph is a .py Python file. Just as Python code can have variables so too can a GNURadio flowgraph by using the Variable block.
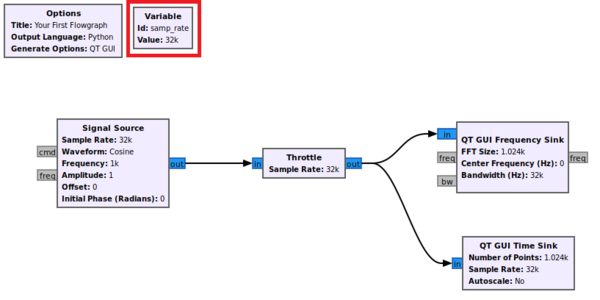
Every new flowgraph starts with the samp_rate variable:
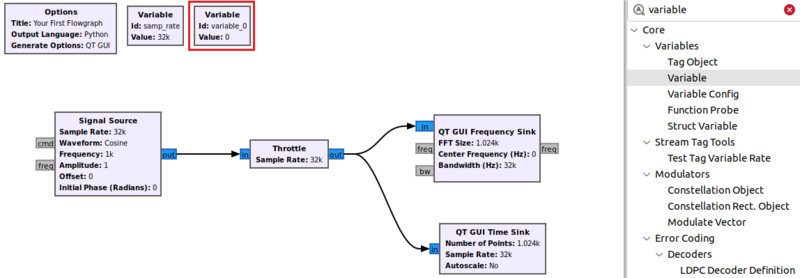
GNURadio blocks are implemented as functions and can take parameters which modify their behavior. All of the blocks in the flowgraph above use samp_rate as a parameter. Create a new variable block by dragging and dropping it from the block library on the right:
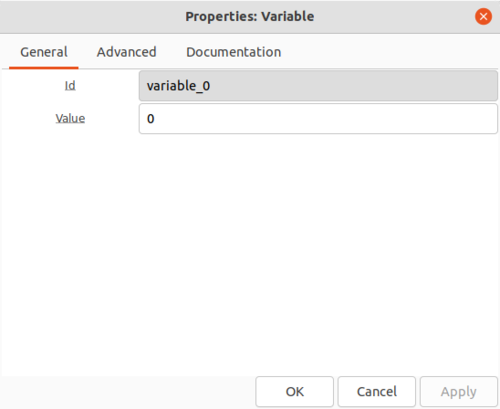
Double-click the variable_0 block to view and modify it's parameters.
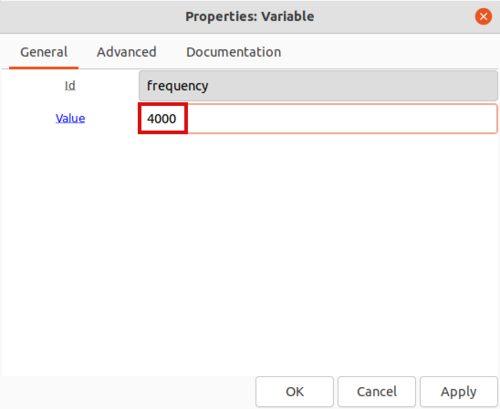
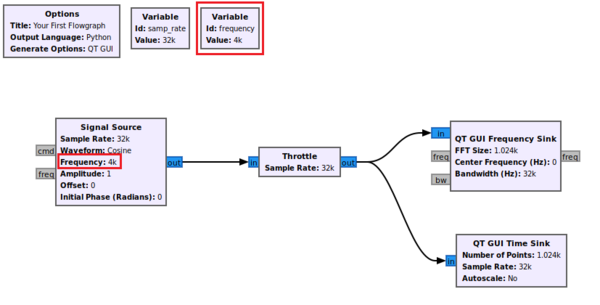
The Id field is the name of the variable. The variable is going to represent the frequency of the Signal Source block, so edit the name to frequency. Now edit the value to 4000.
Click OK to save.
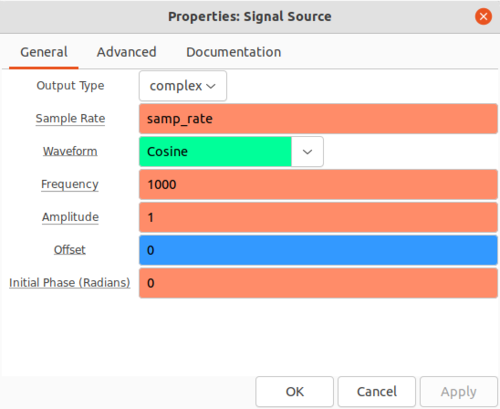
Double-click the Signal Source block to modify its parameters:
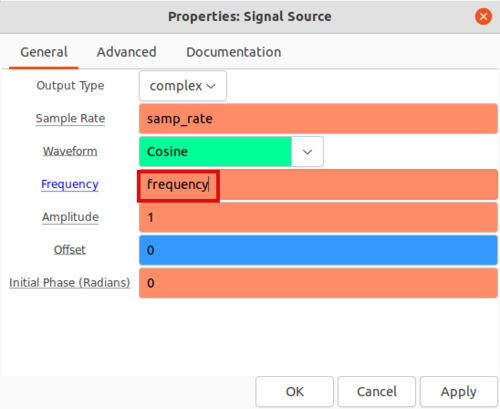
You'll notice that samp_rate is the variable being used for the Sample Rate but Frequency is hard coded to 1000. Enter frequency into the Frequency field:
Click OK to save the properties. You'll notice that the frequency variable name has been updated as well as the parameter within the Signal Source block:
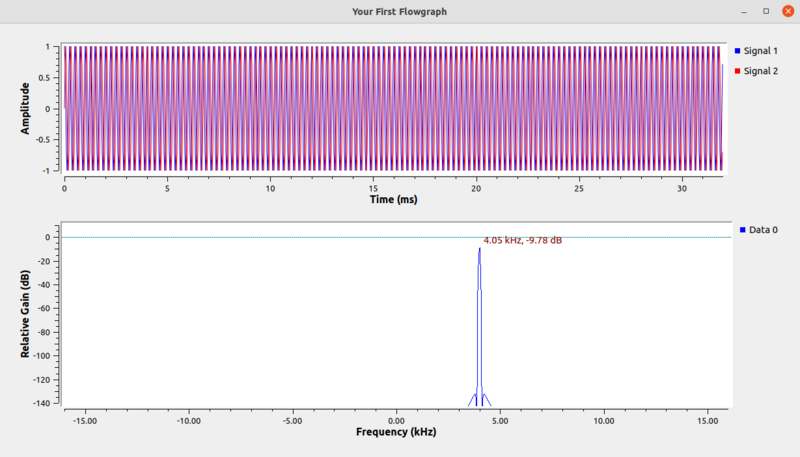
Re-run the flowgraph:
You'll notice that the peak of the frequency response has moved to 4,000 due to the variable that was added.
Dependent Variables
Variables can be dependent on one another in the same way variables in Python can be derived from other variables.
The Id and Value fields are converted into a line of Python in the following manner:
Id = Value
Previously the frequency variable was modified to accept the value 4000, which is the same as a line of Python code:
frequency = 4000
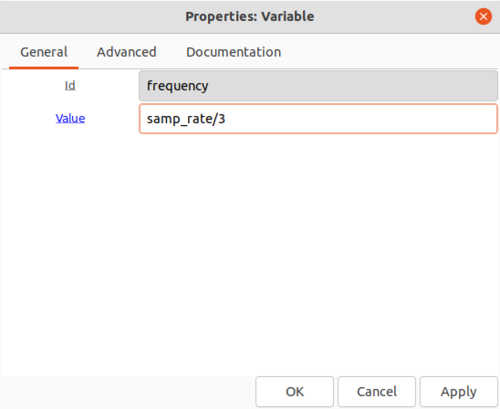
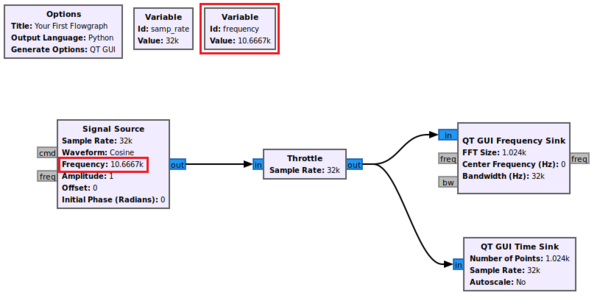
The frequency variable can also be dependent on another variable. Edit frequency such that it is now samp_rate/3, which for samp_rate = 32000 will be a frequency of 10,667.
The change will now ripple through the flowgraph:
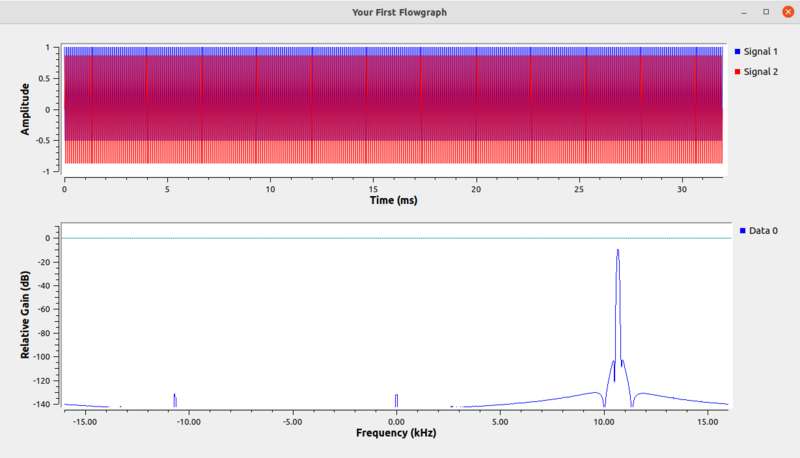
Re-running the flowgraph shows that the frequency has been updated:
The next section will describe how to update variables in real time while the flowgraph is running.
