Reading Binary Files: Difference between revisions
Jesternofool (talk | contribs) (Added math formatting to exponentials) |
|||
| Line 162: | Line 162: | ||
The '''IShort to Complex''' block will apply the inverse of the scale factor, <math> | The '''IShort to Complex''' block will apply the inverse of the scale factor, <math>2^{-15}</math> or 1/32768, producing normalized samples from -1 to +1. | ||
[[File:Reading_binary_files_complex_int_flowgraph_scale_factor.png]] | [[File:Reading_binary_files_complex_int_flowgraph_scale_factor.png]] | ||
| Line 170: | Line 170: | ||
[[File:Reading_binary_files_time_freq_complex_int_display.png|750px]] | [[File:Reading_binary_files_time_freq_complex_int_display.png|750px]] | ||
==Continuous Playback from File== | ==Continuous Playback from File== | ||
Latest revision as of 18:19, 20 April 2024
This tutorial describes how to read binary files using the File Source block along side how to diagnose potential errors.
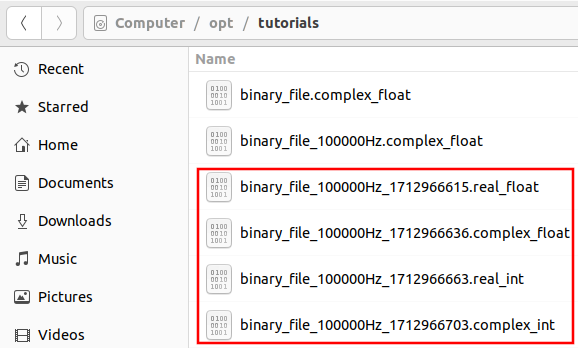
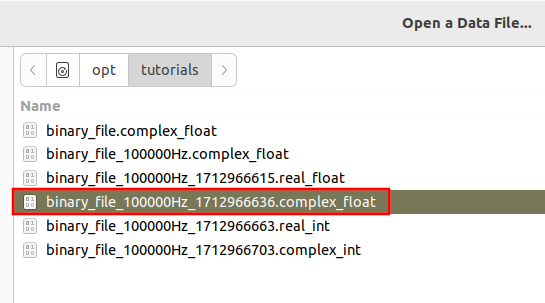
Please review the Writing Binary Files tutorial before continuing. A series of binary files were created with different formats that will be needed for this tutorial:
File Source Block
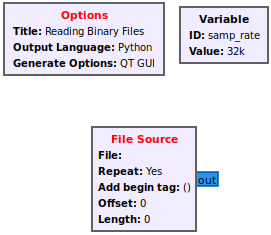
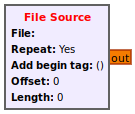
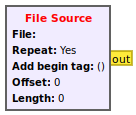
The File Source block reads from a binary file and then sends the samples to the output port. Drag the File Source block into a flowgraph. The block by default uses the complex data type (32-bit floats), represented by the blue output port:
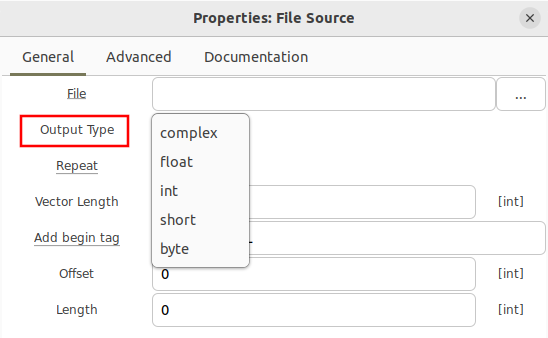
Double clicking the File Source block brings up the properties and the ability to select different data types.
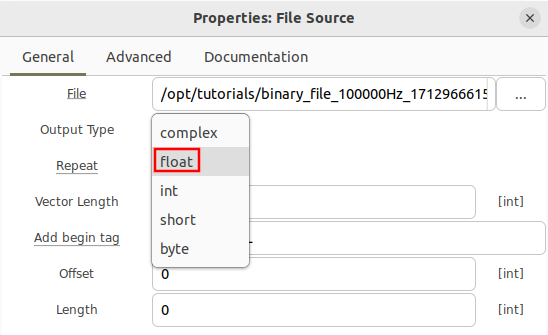
A binary file of real floating point data requires the float data type to be selected, which outputs real floating point samples, denoted by an orange output port.
A binary file of 16-bit signed integers requires the short data type to be selected, which outputs 16-bit integers of either real or interleaved I and Q samples (more on this later in the tutorial), denoted by a yellow output port.
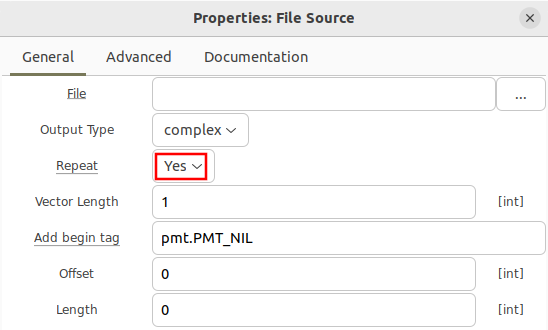
Also note that the File Source has the Repeat field enabled as Yes, which will continually and repeatedly play back the same file. Once the last sample is received in the file it skips back to the first sample in the file and continues cycling through the file.
Reading Complex Float
Add a File Source block, open the properties and begin by selecting the complex type.
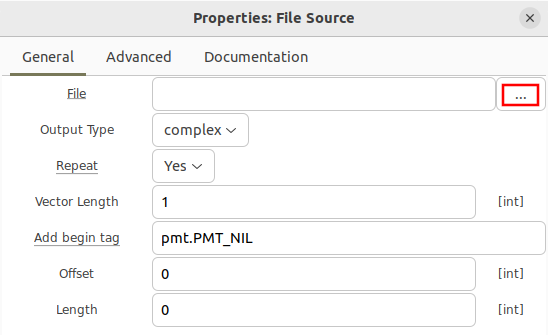
Click the three dots to the right side of the File property to browse to a stored binary file.
Select the file ending in .complex_float:
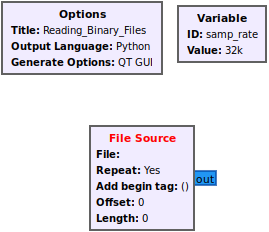
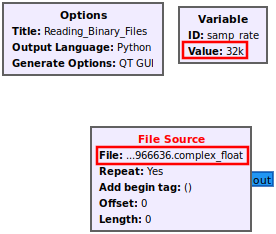
The File Source block will now populate the filename:
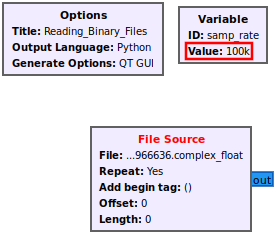
Notice that the filename is now filled in for the File Source however the samp_rate variable is incorrectly 32 kHz (32,000). The sampling rate from the filename is 100 kHz (100,000) therefore update the samp_rate variable:
The change will be reflected in the flowgraph:
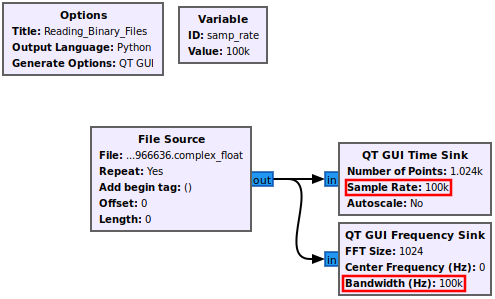
Add in the QT GUI Time Sink and QT GUI Frequency Sink and connect them accordingly. Notice how both blocks use samp_rate variable automatically:
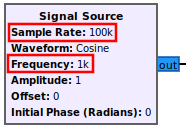
Before running the flowgraph, recall that the Writing Binary Files generated a 1 kHz complex sinusoid at a sampling rate of 100 kHz. When playing the file using the File Source the same waveform should be seen.
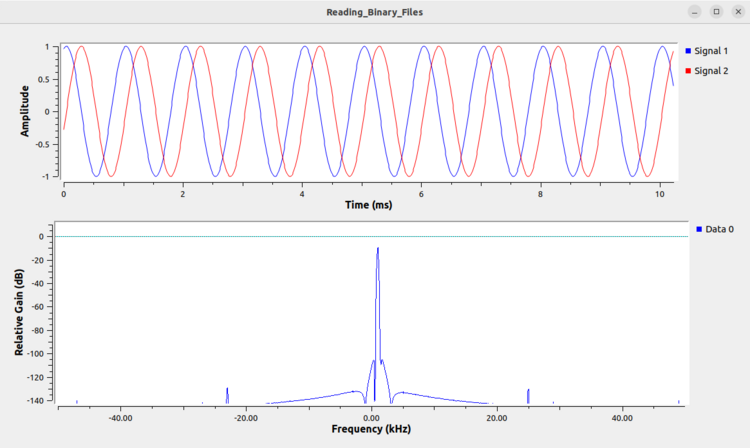
Now run the flowgraph. Notice that the time-domain plot has sinusoidal shapes on the I and Q channels, characteristic of a complex sinusoid. Also notice how the frequency plot displays a tone with a single peak, also characteristic of a complex sinusoid. Finally, notice how the peak of the frequency plot has a peak of approximately 1 kHz confirming that the binary file was read properly and the samp_rate variable was set properly.
Reading Real Float
To read from a file storing real samples encoded as floating point numbers, open the File Source and change the Output Type to float:
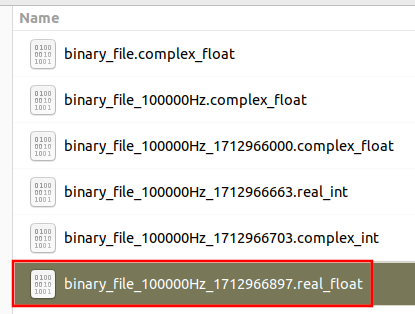
Click the three dots next to File and select the file ending in .real_float:
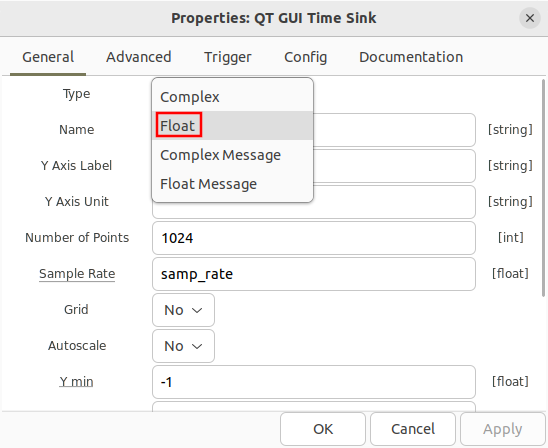
Open the QT GUI Time Sink properties and change the type to float:
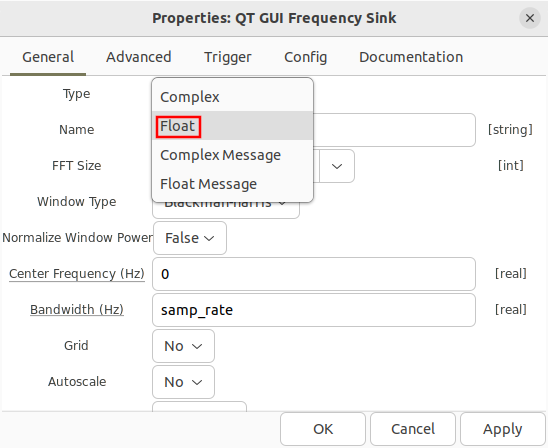
Open the QT GUI Freq Sink properties and change the type to float:
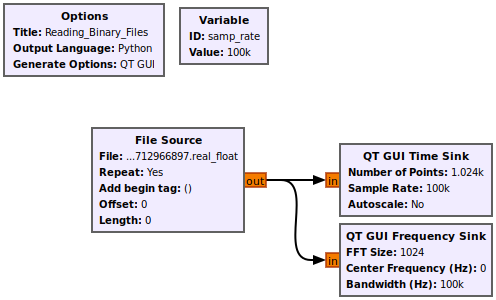
The flowgraph should now look like the following:
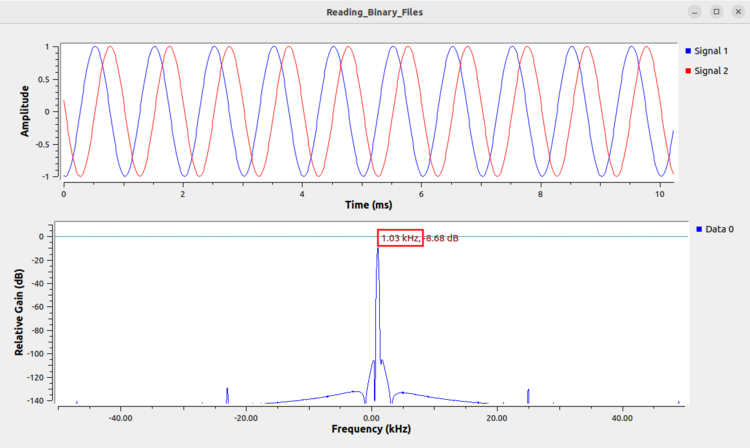
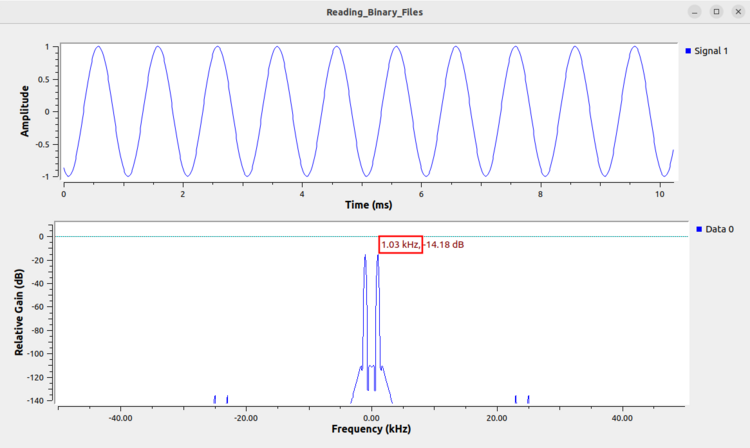
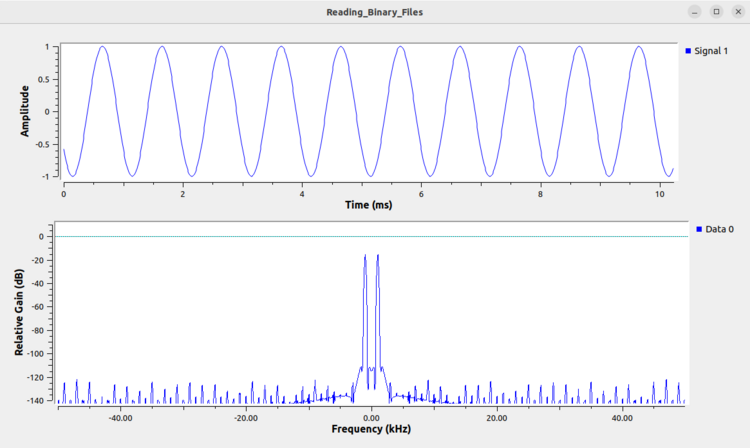
Run the flowgraph. Notice that the time-domain plot displays a single sinusoid, characteristic of a real sinusoid waveform. Also notice that the frequency domain plot displays two peaks, characteristic of a real sinusoid. Finally, notice that the peak on the right hand side, the positive frequencies, is at approximately 1 kHz, confirming that the binary file was read properly and the samp_rate variable is set properly.
Reading Real Integers
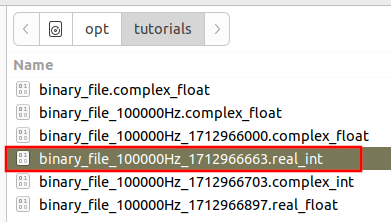
Begin by adding a File Source block. Open the properties and navigate to the file ending in .real_int:
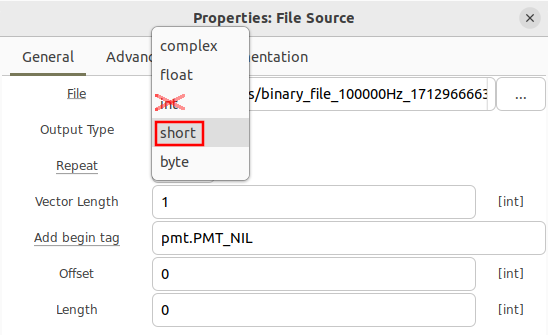
Change the Output Type property to be short. Be sure not to select int:
Add in a Short to Float block and connect it accordingly:
Notice that the scale factor here is set to 1. This will plot all of the values at full scale, which is from to , or 32,768 to +32767. Running the flowgraph with a scaling value of 1 is valid, although some flowgraphs may use a scale factor in order to normalize the data to be within -1 to +1. Open the Short to Float properties and enter a scale factor of 2^15:
The Short to Float block applies the inverse of the scale factor, meaning it will scale the output samples by or 1/32768. The flowgraph will now look like the following:
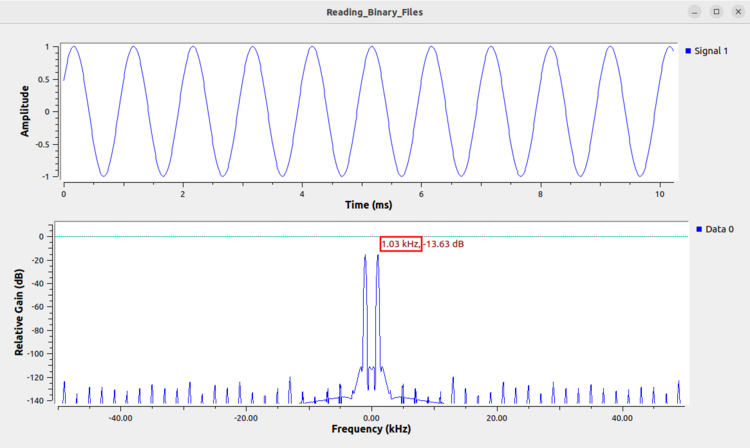
Running the flowgraph displays the file after being read as real integers. The time domain plot displays a single sinusoid which is characteristic of a real sinusoid, and the frequency domain plot displays two tones which is also characteristic of a real sinusoid. Finally, the peak at the positive frequency tone is approximately 1 kHz which confirms that the file is being read correctly.
Reading Complex Integers
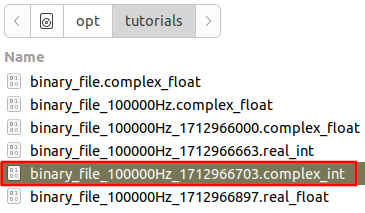
Begin by adding a File Source block. Open the properties and navigate to the file ending in .complex_int:
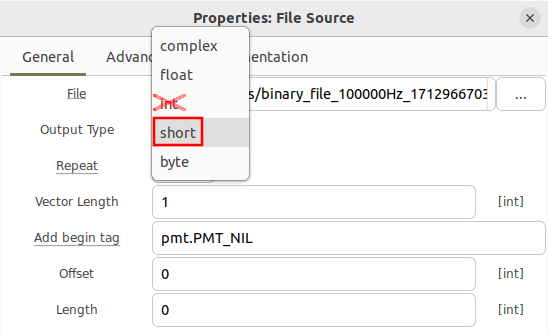
Open the File Source properties and select the short data type. Do not select the int type:
Drag in a IShort to Complex block and connect it accordingly. Convert the QT GUI Time Sink and QT GUI Frequency Sink blocks into the complex data type. The flowgraph should look like the following.
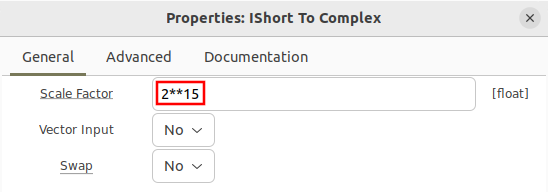
Note that the IShort to Complex block has a scale factor of 1, which would plot the data on a range of to , or -32,768 to +32,767. Running the flowgraph in this state is valid. However, some flowgraphs require normalization such that all values are within -1 and +1. To do so, open the block’s properties and use a scale factor of :
The IShort to Complex block will apply the inverse of the scale factor, or 1/32768, producing normalized samples from -1 to +1.
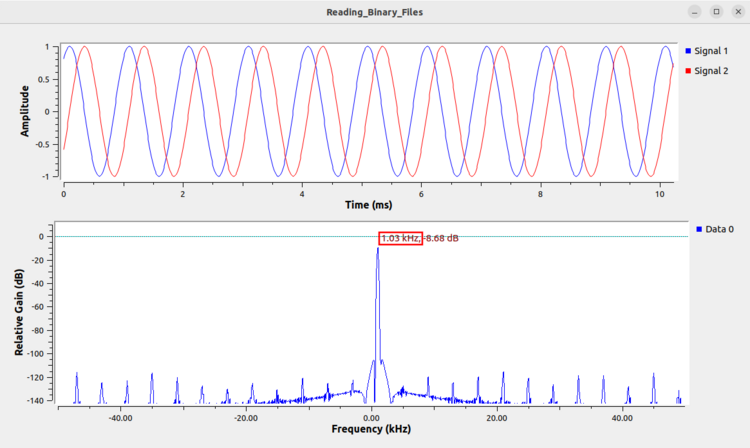
Run the flowgraph. The time domain plot displays two sinusoids, characteristic of a complex sinusoid. The frequency domain plot displays a single tone, also characteristic of a complex sinusoid. Finally, the tone is at approximate 1 kHz which confirms that the file is being read correctly.
Continuous Playback from File
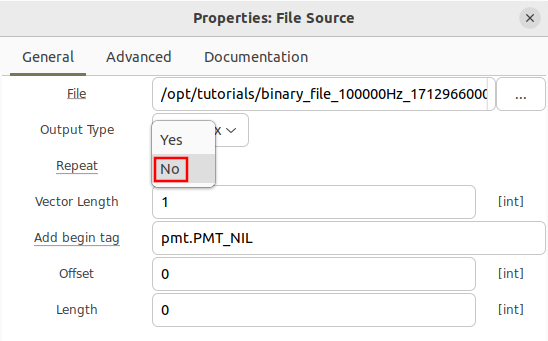
The File Source block comes with the option to repeat playback from file. When Yes is selected for repeat, the samples will be played back on loop until the flowgraph is stopped.
When No is selected for repeat, then all of the samples will be read from file and then the flowgraph will stop running once the last sample is read and then processed through the flowgraph.
Diagnosing Errors: Wrong Type and Format
In order to properly read a binary file both the type (real or complex) and format (integer or floating point) need to be known. If given a file and the type or format is unknown, it is best to check all possible combinations and to see which is the most reasonable. Endianness (described in the next section) is another potential problem when reading binary files.
The following are examples of a file being read improperly. Warning: different recordings will present different type and format errors differently, the images presented here are not exhaustive and are only a couple of examples to help build intuition to diagnose these kinds of errors.
The following image is an example of a real integer being read as real floats. Note how large the values are in the time domain: on the order of ! Values that are abnormally small or abnormally large clearly indicate the file is not being read correctly.
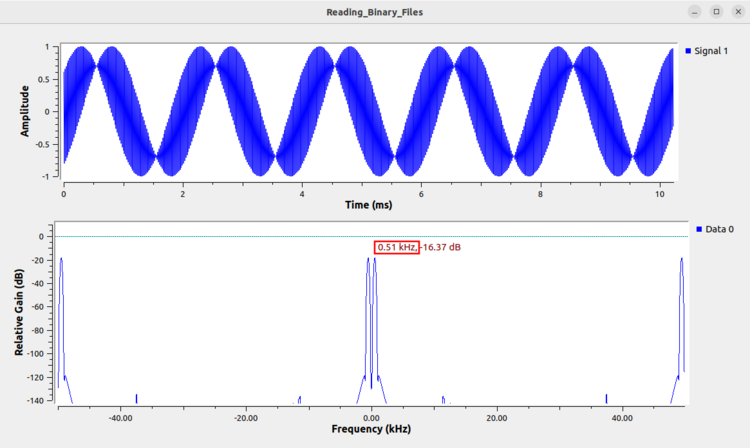
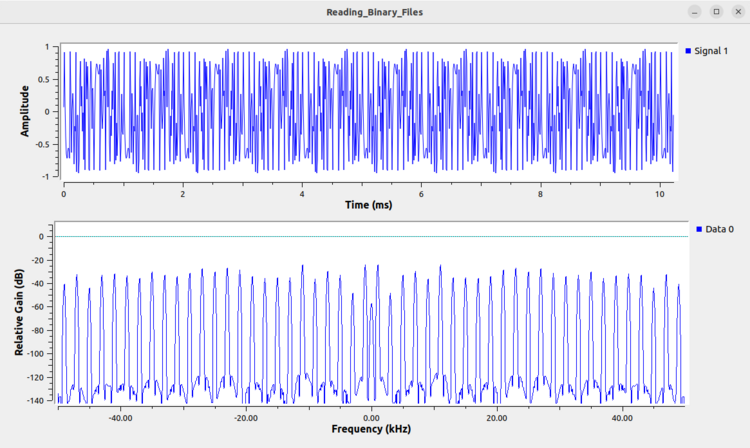
The following image is an example of complex floats being read as real floats. This kind of error can be deceptive because both the time domain and frequency domain are reasonable. The time domain has a semi-sinusoidal effect and the frequency domain has a series of peaks. Without knowing the underlying data, it could be reasonable to assume this file is being read correctly. However, it is important to try the different combinations of type and format, and reading the file as complex floats should more clearly reveal the true nature of the file.
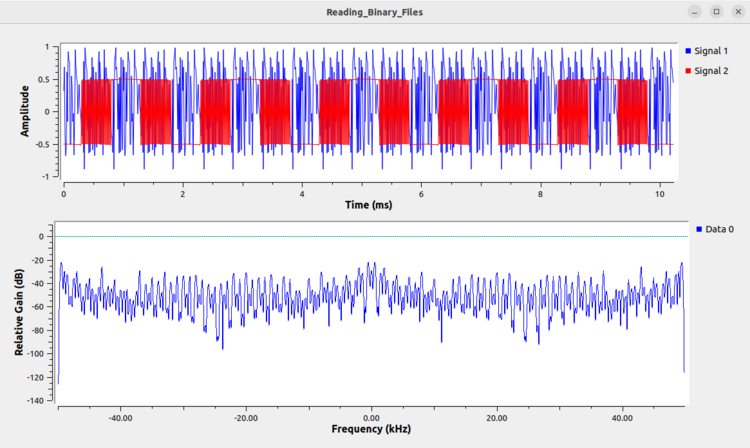
The following image shows the result when a complex floats are read as complex integers. Note that the imaginary portion of the time domain in the red represents a very strange shape which is suggestive that the file is being read incorrectly. Similarly, the frequency domain plot does not display a clearly intelligible signal.
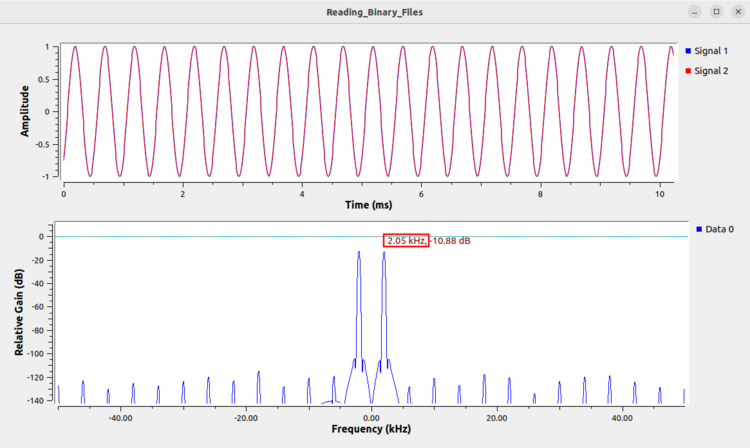
The following image is a binary file of real integers being read as complex integers. This one is tricky because at first glance it appears to be tricky, but for a complex sinusoid the real and imaginary data should be pi/2 radians out of phase with one another. Also note that the highlighted frequency is 2 kHz, and not 1 kHz as it should be, another indicator that the file was not read correctly. This is an example of why it it is important to try the different combinations of type and format, such that reading the file as complex integers should allow the user to recognize the signal is being read correctly.
Diagnosing Errors: Endianness
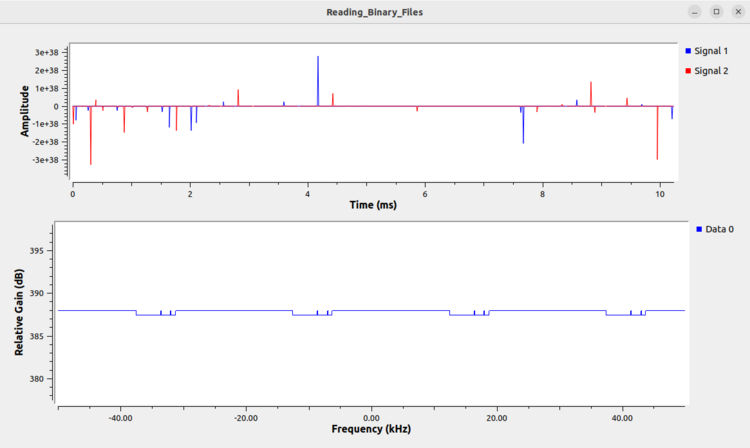
Endianness describes the ordering of the bits,from most significant bit (MSB) to least significant bit (LSB). Different processing architectures use different endianness and that is another factor effecting how binary files are interpreted. Endianness is only a potential problem when dealing with files from different processing systems, and therefore not an issue when performing playback from a capture taken from the same native system.
The following image is an example of a complex float file being read using the incorrect endianness:
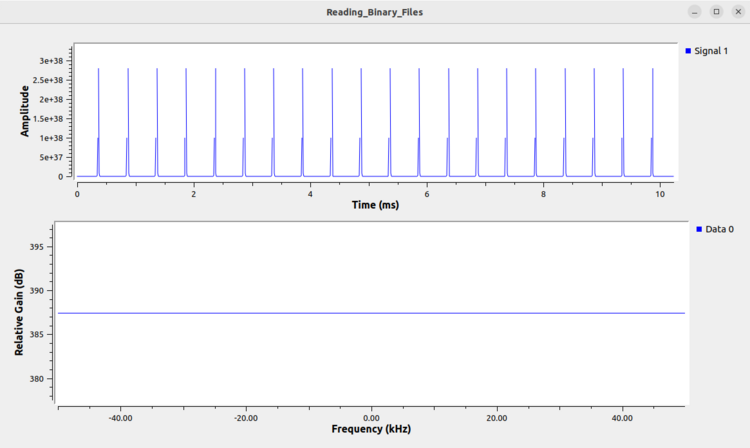
The values being abnormally large (10^38) is a clear indicator that the file is being read incorrectly. Add the Endian Swap block to the flowgraph at the output of the File Source:
Running the flowgraph now displays the correct result:
The following image is an example of real integers being read with the incorrect endianness:
This error can be correct by using the Endian Swap block and selecting the short data type and connecting it in the flowgraph after the File Source:
Running the updated flowgraph now displays the correct result:
