GR-ATA Tutorial
On this page we'll walk through a few scenarios of running observations (both real and simulated) on the Allen Telescope Array with GNU Radio and the gr-ata module.
Step 0: Before you start...
In order to run an observation on the ATA, please know that you must coordinate with ATA staff to avoid interfering with science observing campaigns onsite.
Please find a catalog of astronomical sources recognized by the gr-ata module here: https://github.com/SETIatHCRO/gr-ata/blob/master/docs/ata-catalog.txt
Before beginning this tutorial, please make sure that you have installed GNU Radio version 3.8, gr-ata, and the ATA-Utils library, following the instructions here: Setting up the software
Tutorial 1: A Simulated ATA Observation
In this first tutorial, we will run through a simulated offline "observing" session -- although in this tutorial we won't be conducting real observations, it is a good idea to start here to make sure you understand what the gr-ata blocks are doing and get familiar with the system and terminology before starting your real observation. This mode of running the gr-ata blocks does not require you to be able to connect to the ATA computers, either, so it is a good place to start.
Let's first try a very simple test. Drag and drop an ATA Track Scan block and an ATA Control block into an empty flowgraph and connect their message ports as shown below.
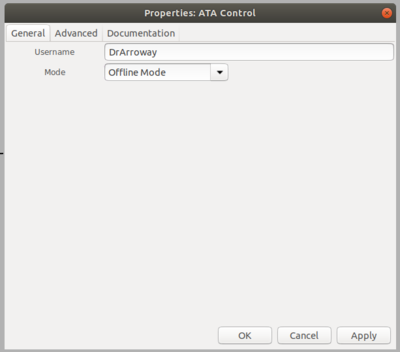
Make sure you have changed the ID field in the automatically-populated Options block to something besides default or the program won't run. Now double click the Control block to bring up the Properties window. Enter your username (for the offline tutorial this field doesn't matter, just type anything), then select Offline Mode from the Mode drop-down list, as shown. Click OK to apply your changes and close the Properties window.
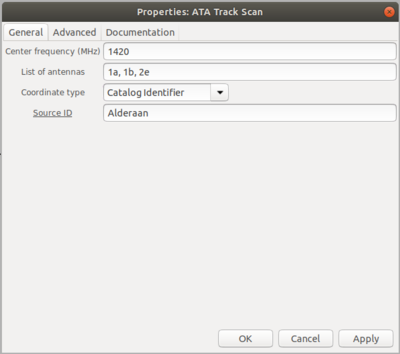
Now double click on the Track Scan block to view its properties. The first field is Frequency (MHz) -- enter any number of your choice here (it doesn't really matter what you enter in Offline Mode, just so long as it is a number). The next field is List of antennas; this field requires a string or list of strings as input, entered as shown. To simulate a real observing session, you could enter one or more of the actual antenna names of ATA antennas by choosing from the following list: 1a, 1b, 1c, 1d, 1e, 1f, 1g, 1h, 1j, 1k, 2a, 2b, 2c, 2d, 2e, 2f, 2g, 2h, 2j, 2k, 2l, 2m, 3c, 3d, 3e, 3f, 3g, 3h, 3j, 3l, 4e, 4f, 4g, 4h, 4j, 4k, 4l, 5b, 5c, 5e, 5g, 5h as shown. Next, select how you want to enter your target source in the Coordinate Type drop-down -- you can choose Catalog Identifier (as in the example below), RA / Dec, or Az / El. If you choose Catalog Identifier, a Source ID field will be displayed, where you can enter a source name -- in Offline Mode this source name can be anything, but in Observing Mode you must select an identifier from this catalog. If you select RA / Dec, separate RA and Dec fields will be displayed where you can enter your coordinates in decimal degrees; similarly if you select Az / El, Az and El fields will be displayed as well.
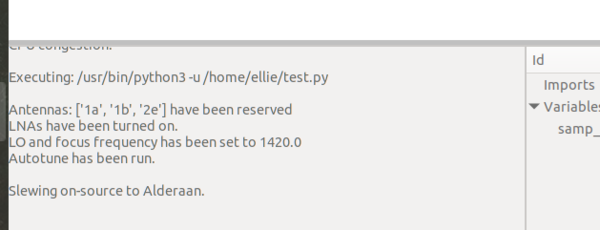
Now that you have connected the two blocks and filled out the required fields, you can save your flowgraph then hit Run. You should see output in the terminal window as shown:
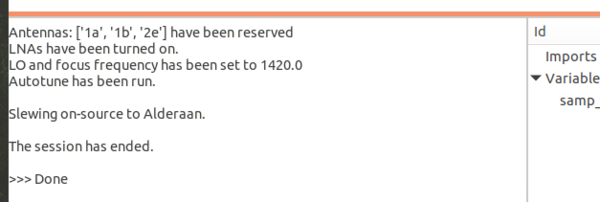
Once the text has printed, you can close the flowgraph, and an exit message will be printed:


