Signal Data Types
This tutorial describes the data types which can be used to represent signals.
The starting flowgraph from Your First Flowgraph is used in this section, please complete the tutorial before proceeding. The next tutorial, Converting Data Types, shows how to convert between different data types.
Data Types
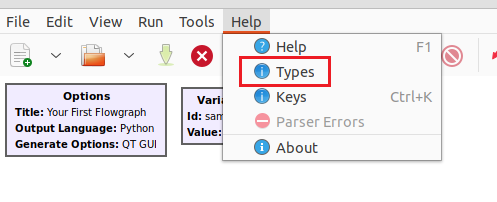
Every input and output port on a block will have a data type associated with it. The data type is identified by the color of the input and output port. The GNU Radio data types can be found by opening GNU Radio Companion (GRC) and clicking Help, Types:
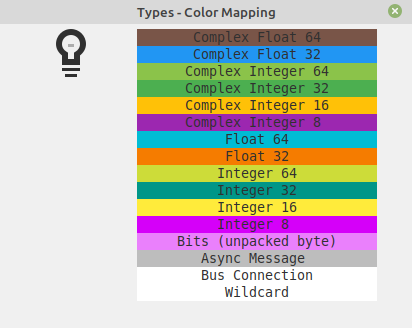
A window displays the data types and their associated colors:
The most common data types in GNU Radio blocks are Complex Float 32 in blue and Float 32 in orange.
Complex Data Type
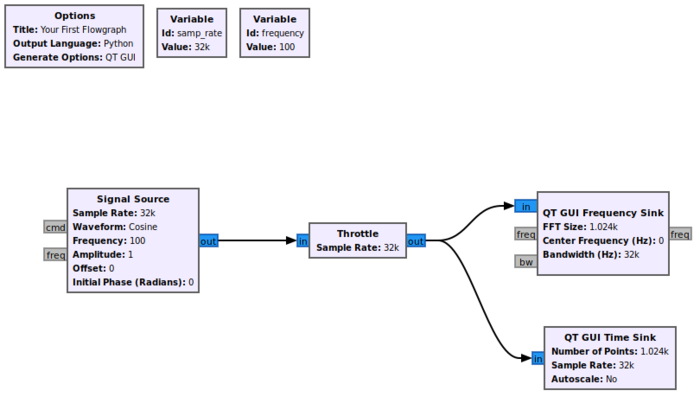
The following flowgraph uses the Complex Float 32 data type, which uses a 32-bit float to represent the real and imaginary portions of a complex sample.
Running the flowgraph shows the complex signal plotted in the time domain, where Signal 1 is the real component and Signal 2 is the imaginary component of the complex signal:
Each complex sample is therefore 64 bits: a 32-bit float for the real component, and a 32-bit float for the imaginary component.
Float Data Type
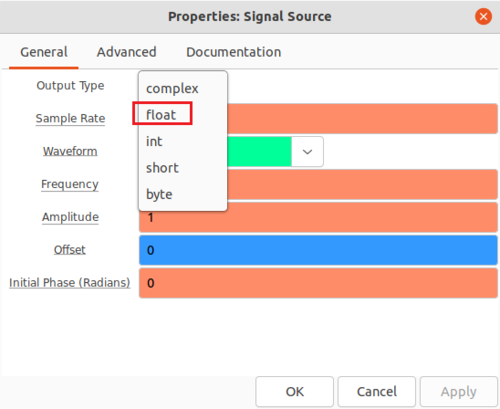
Many GNU Radio blocks support multiple data types. The data type of the Signal Source block can be changed by double-clicking it and selecting from the Output Type drop-down menu:
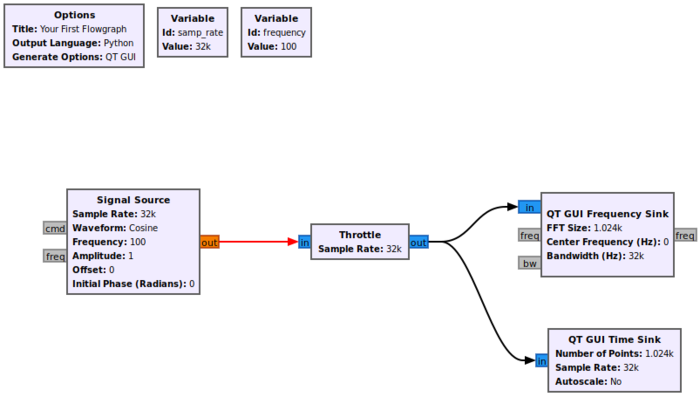
Selecting the float data type will have the Signal Source block create a real sinusoid, represented by the orange output port. Note the arrow connecting Signal Source to Throttle is now red, indicating a data type mismatch error:
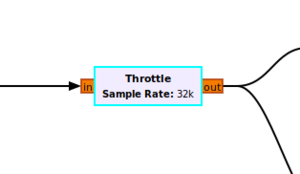
The error is resolved by converting all of the other blocks to the orange Float data type. Data types may be cycled by clicking on the block, which is then highlighted in light blue, and pressing UP or DOWN on the keyboard:
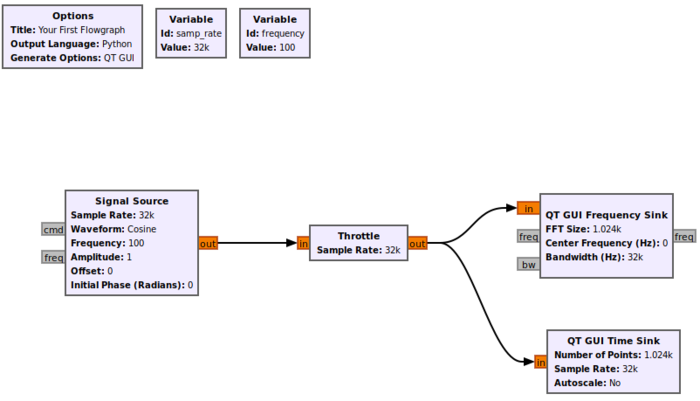
The flowgraph is complete after all data types have been converted to Float:
The Signal Source block creates a real output, which is displayed as the only signal in the time domain:
The next tutorial, Converting Data Types, shows how to convert between different data types. Eventually we will learn about vector streams, as part of Python Block with Vectors.
