GNURadio@theATA
The Allen Telescope Array (ATA) is a 42-element radio telescope array located in Hat Creek, California, operated jointly by SETI Institute and UC Berkeley SETI Research Center. In an effort to increase accessibility to the array among potential users outside the astronomy community, we are working to integrate the array into GNU Radio software. We plan to start out by connecting USRPs to two ATA antennas and developing control, backend, and beamformer software. In addition to this, we are using a discone antenna connected to a USRP and OmniSig software to analyze radio frequency interference (RFI) at the ATA site.
General Info
Useful info about the ATA and friends:
GNU Radio / SETI Hackathon
In May 2019, the first step toward collaboration between the GNU Radio community, the ATA, SETI Institute, Breakthrough Listen, and Berkeley SETI communities consisted of a hackathon hosted at the Hat Creek Radio Observatory (home of the ATA). This culminated in, among other things, the development of a GNU Radio module called gr-ata.
- Here's a link to material from the hackathon: https://github.com/SETIatHCRO/grhack/wiki
- And here's where you can find the ATA module: https://github.com/SETIatHCRO/gr-ata
Connecting to VNC on ATA gnuradio machines
Below are instructions for connecting to the ATA machines' VNC servers on Windows (note that gnuradio0 machine is connected to the discone, gnuradio1 will be connected to the ATA antennas).
Assuming you are connected to the ATA gnuradio vpn server, you can use PUTTY to connect to gnuradio1 or gnuradio0 machine:
- Hostname (IP address): 10.1.50.10 for gnuradio0, or 10.1.50.11 for gnuradio1.
- SSH -> Enable compression
- SSH -> Tunnels -> Source port: 590x, Destination: localhost:590x
VNC Viewer:
- Remote Host: localhost:590x
- Enter password
Setting up the software
The first step in implementing GNU Radio with the ATA is ensuring that we can effectively play back previously-recorded SigMF files taken by the ATA in a GNU Radio flowgraph. We can do this using example code from the gr-ata module discussed above. To get the flowgraphs included in the "examples" folder of gr-ata working, here's a recipe of what you'll need (along with some installation tips discovered through trial-and-error). Note that the instructions below are written for Ubuntu users:
- GNU Radio version 3.8 (ppa for "releases" -- install instructions here).
- cmake version >= 3.13 (will have to remove the standard cmake version using $ sudo apt remove --autoremove cmake, then follow the instructions here: https://apt.kitware.com/ to install a more recent version. This is necessary for installing gr-osmosdr)
Below is a list of external GNU Radio modules that you should install following the instructions on the linked GitHub pages. One thing to keep in mind -- for the cmake step, in some cases cmake automatically installs the modules to the wrong location, resulting in a ModuleNotFound error. To prevent this, instead of running just cmake .. run the following command: $ cmake -DCMAKE_INSTALL_PREFIX:PATH={prefix} .. where the {prefix} can be found using the command $ gnuradio-config-info --prefix.
- gr-ata (of course!)
- gr-osmosdr
- gr-correctiq -- make sure to clone the branch maint-3.8
- gr-lfast -- make sure to clone the branch maint-3.8
- gr-grnet -- branch maint-3.8. Before attempting to install gr-grnet, make sure you've run $ sudo apt-get install zlib1g-dev libpcap-dev
- gr-filerepeater -- branch maint-3.8
- gr-gpredict-doppler
- gr-mesa -- branch maint-3.8
- gr-fosphor -- before attempting to install gr-fosphor, run the command: $ sudo apt install libglu1-mesa-dev freeglut3-dev mesa-common-dev ocl-icd-opencl-dev freetype2-demos libfreetype6 libfreetype6-dev swig qt5-default
- gr-compress --branch maint-3.8; follow instructions in README on github for installation prerequisites
Plotting data in GNU Radio
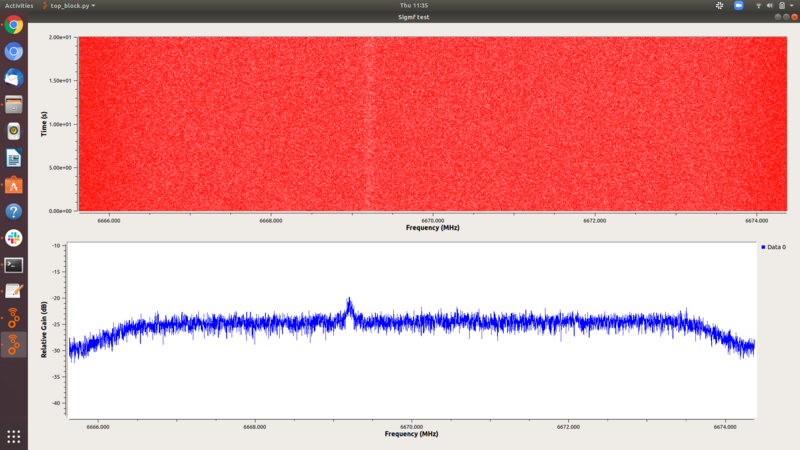
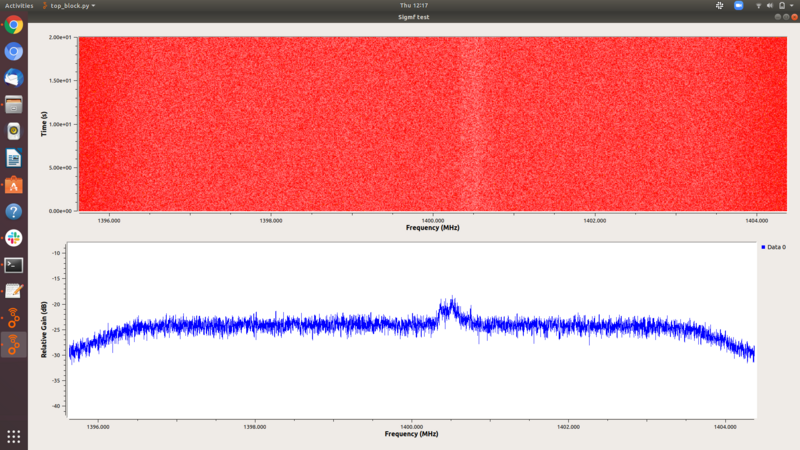
Using a very simple GNU Radio flowgraph, we can plot spectrum data from archival ATA data; below are some examples:
Figure 1: GNU Radio waterfall and frequency plots of a 6.7 GHz methanol maser, W3OH, from 2010 archival ATA data
Figure 2: GNU Radio waterfall and frequency plots of the neutral hydrogen (HI) line in the direction of the pulsar psrb0329+54, also from 2010 ATA data.

