Complex to Mag Squared: Difference between revisions
(Created page with "Category:Block Docs Calculates the magnitude of the input, and squares it. Can also work on vectors.") |
Jesternofool (talk | contribs) (Expanded description and added two examples using the Complex to Mag^2 block.) |
||
| Line 1: | Line 1: | ||
This block inputs a complex sample, then calculates the squared magnitude of each sample. | |||
== Overview == | |||
The block appears as follows. Its input is a complex sample; the output will be real-only samples. | |||
[[File:Complex-to-Mag2-block.png]] | |||
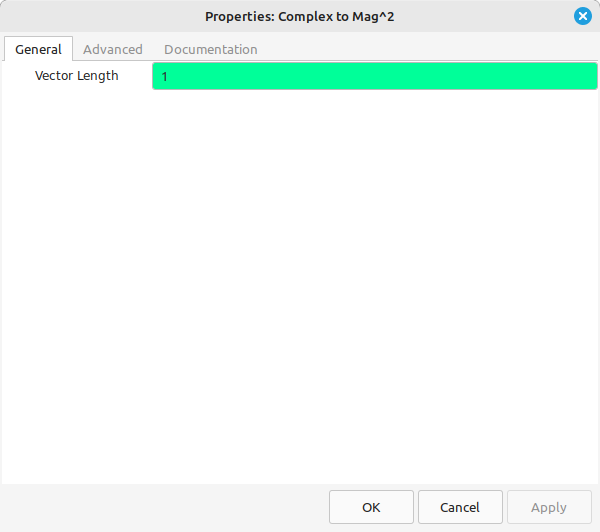
The only adjustable parameter is the vector length. | |||
[[File:Complex-to-Mag2-block-properties.png]] | |||
== Mathematical Description == | |||
The magnitude of a complex sample can be expressed as <math>c[n] = \sqrt{r[n]^2 + i[n]^2}</math> | |||
The magnitude squared of a complex sample is just <math>c[n]^2 = r[n]^2 + i[n]^2</math> | |||
If the input signal is a simple complex sinusoid, then <math>r[n] = A cos[2\pi n fc/fs]</math> and <math>i[n] = A sin[2\pi n fc/fs]</math>. The result of the complex magnitude squared would be equivalent to: | |||
<math>c[n]^2 = r[n]^2 + i[n]^2</math>, so <math>c[n]^2 = (A cos[2\pi n fc/fs])^2 + (A sin[2\pi n fc/fs])^2</math> <math>= A^2 (cos^2[2\pi n fc/fs] + sin^2[2\pi n fc/fs])</math> | |||
<math>cos^2 + sin^2 = 1</math>, so <math>A^2 (cos^2[2\pi n fc/fs] + sin^2[2\pi n fc/fs]) = A^2</math> | |||
== Parameters == | |||
; Vector Length | |||
: integer value for the grouping of samples into a vector. Default value: 1. | |||
== Example Flowgraphs == | |||
=== Example #1: Measuring Signal-to-Noise Ratio === | |||
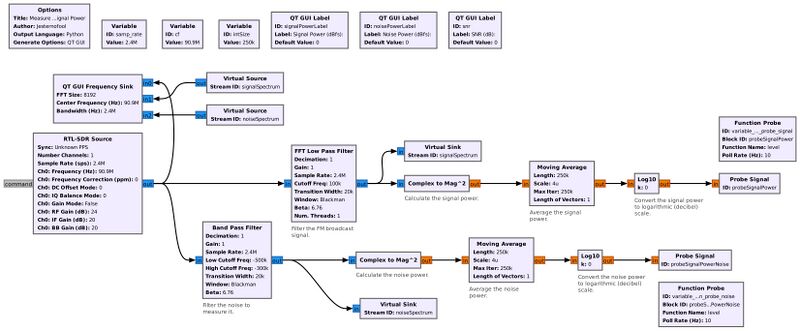
This flowgraph will measure the signal-to-noise ratio from a RTL-SDR for a FM broadcast station. (NOTE: This requires having a portion of the spectrum that has no signals present. This portion will be used to measure the noise power.) | |||
[[File:MeasureFmSignalPower.jpg|800px]] | |||
The output of the RTL-SDR is split between a lowpass filter (used to filter out the signal) and a bandpass filter (used to filter out a portion of noise with the same bandwidth as the signal). The output of each filter is input to the '''Complex to Mag^2''' block, which essentially calculates the power of each. | |||
[[File:Measure-signal-power-display.png|800px]] | |||
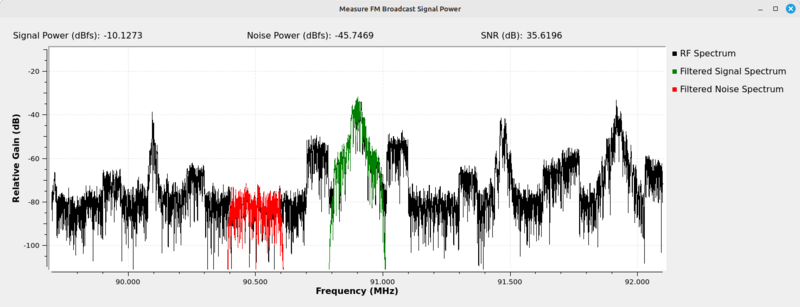
The output shows the original RF spectrum (black trace), the filtered signal (green trace) and the filtered noise (red trace). It calculates the signal-to-noise ratio (SNR) between the two and displays them at the top of the window. As the RTL-SDR does not provide calibrated power measurements, the measurements for both the signal and noise are measured as ''dBfs'', or "decibels relative to full scale". | |||
Flowgraph used for this demonstration: [[File:MeasureFmSignalPower.grc]] | |||
=== Example #2: Creating a Spectral Display === | |||
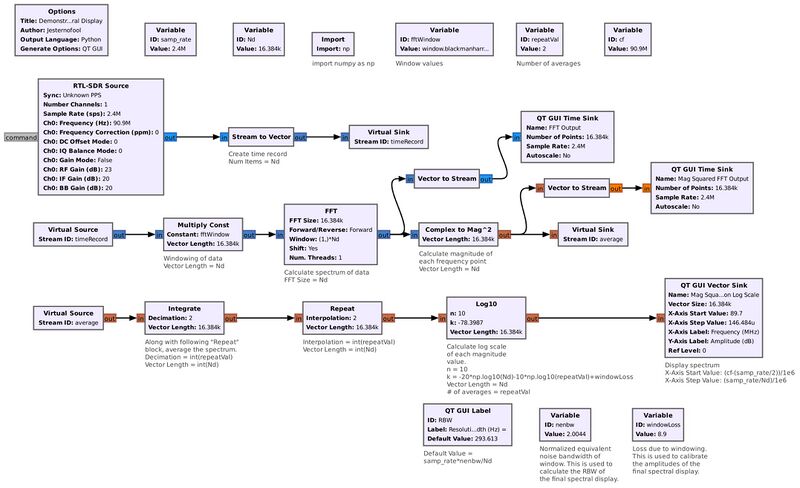
The following flowgraph creates a basic spectral display. The '''Complex to Mag^2''' block calculates the power of each spectral point. | |||
[[File:ComplexMagSquaredSpectrum.jpg|800px]] | |||
The [[FFT]] block creates a vector that is the frequency domain version of the input signal. The '''Complex to Mag^2''' block calculates the power of each frequency point at the output of the FFT. | |||
Flowgraph used for this demonstration: [[File:ComplexMagSquaredSpectrum.grc]] | |||
== Source Files == | |||
; C++ files | |||
: [https://github.com/gnuradio/gnuradio/blob/main/gr-blocks/lib/complex_to_mag_squared_impl.cc complex_to_mag_squared_impl.cc] | |||
; Header files | |||
: [https://github.com/gnuradio/gnuradio/blob/main/gr-blocks/lib/complex_to_mag_squared_impl.h complex_to_mag_squared_impl.h] | |||
; Public header files | |||
: [https://github.com/gnuradio/gnuradio/blob/main/gr-blocks/include/gnuradio/blocks/complex_to_mag_squared.h complex_to_mag_squared.h] | |||
; Block definition | |||
: [https://github.com/gnuradio/gnuradio/blob/main/gr-blocks/grc/blocks_complex_to_mag_squared.block.yml blocks_complex_to_mag_squared.block.yml] | |||
[[Category:Block Docs]] | [[Category:Block Docs]] | ||
Latest revision as of 17:31, 13 April 2024
This block inputs a complex sample, then calculates the squared magnitude of each sample.
Overview
The block appears as follows. Its input is a complex sample; the output will be real-only samples.
The only adjustable parameter is the vector length.
Mathematical Description
The magnitude of a complex sample can be expressed as
The magnitude squared of a complex sample is just
If the input signal is a simple complex sinusoid, then and . The result of the complex magnitude squared would be equivalent to:
, so
, so
Parameters
- Vector Length
- integer value for the grouping of samples into a vector. Default value: 1.
Example Flowgraphs
Example #1: Measuring Signal-to-Noise Ratio
This flowgraph will measure the signal-to-noise ratio from a RTL-SDR for a FM broadcast station. (NOTE: This requires having a portion of the spectrum that has no signals present. This portion will be used to measure the noise power.)
The output of the RTL-SDR is split between a lowpass filter (used to filter out the signal) and a bandpass filter (used to filter out a portion of noise with the same bandwidth as the signal). The output of each filter is input to the Complex to Mag^2 block, which essentially calculates the power of each.
The output shows the original RF spectrum (black trace), the filtered signal (green trace) and the filtered noise (red trace). It calculates the signal-to-noise ratio (SNR) between the two and displays them at the top of the window. As the RTL-SDR does not provide calibrated power measurements, the measurements for both the signal and noise are measured as dBfs, or "decibels relative to full scale".
Flowgraph used for this demonstration: File:MeasureFmSignalPower.grc
Example #2: Creating a Spectral Display
The following flowgraph creates a basic spectral display. The Complex to Mag^2 block calculates the power of each spectral point.
The FFT block creates a vector that is the frequency domain version of the input signal. The Complex to Mag^2 block calculates the power of each frequency point at the output of the FFT.
Flowgraph used for this demonstration: File:ComplexMagSquaredSpectrum.grc
Source Files
- C++ files
- complex_to_mag_squared_impl.cc
- Header files
- complex_to_mag_squared_impl.h
- Public header files
- complex_to_mag_squared.h
- Block definition
- blocks_complex_to_mag_squared.block.yml


![{\displaystyle c[n]={\sqrt {r[n]^{2}+i[n]^{2}}}}](https://en.wikipedia.org/api/rest_v1/media/math/render/svg/bb162e8fff117c068e4dd32ca9d9cc6aff110a7b)
![{\displaystyle c[n]^{2}=r[n]^{2}+i[n]^{2}}](https://en.wikipedia.org/api/rest_v1/media/math/render/svg/a586c94f52989ff770ea6be5ac4387e95665e735)
![{\displaystyle r[n]=Acos[2\pi nfc/fs]}](https://en.wikipedia.org/api/rest_v1/media/math/render/svg/c537c1223ea1fcb338c37a2b57479875a3502fef)
![{\displaystyle i[n]=Asin[2\pi nfc/fs]}](https://en.wikipedia.org/api/rest_v1/media/math/render/svg/f1f735e1228f5756ce44126d54f611da7cd6ba7e)
![{\displaystyle c[n]^{2}=(Acos[2\pi nfc/fs])^{2}+(Asin[2\pi nfc/fs])^{2}}](https://en.wikipedia.org/api/rest_v1/media/math/render/svg/797e24ef38fad8625ff76974ffe6854d3708e021)
![{\displaystyle =A^{2}(cos^{2}[2\pi nfc/fs]+sin^{2}[2\pi nfc/fs])}](https://en.wikipedia.org/api/rest_v1/media/math/render/svg/335dce1da6d5d07aa3a1424138bc5f6e6fb81248)

![{\displaystyle A^{2}(cos^{2}[2\pi nfc/fs]+sin^{2}[2\pi nfc/fs])=A^{2}}](https://en.wikipedia.org/api/rest_v1/media/math/render/svg/4b96e6ef53e9a1b35e5de2938a5911ac4f4a9693)


