QT GUI Waterfall Sink
Jump to navigation
Jump to search
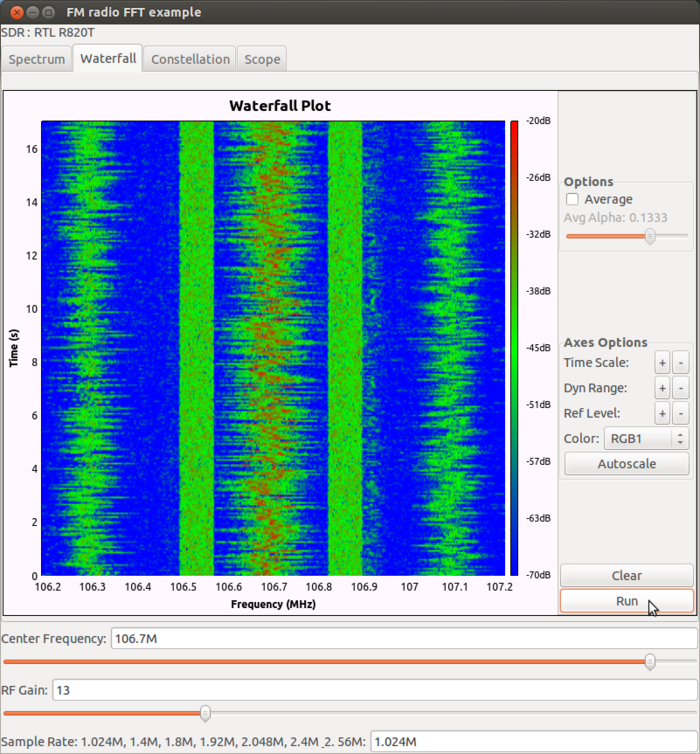
A graphical sink to display multiple signals on a waterfall (spectrogram) plot.
Note that unlike the other qtgui sinks, this one does not support multiple input streams. We have yet to figure out a good way to display multiple, independent signals on this kind of a plot. If there are any suggestions or examples of this, we would love to see them. Otherwise, to display multiple signals here, it's probably best to sum the signals together and connect that here.
Most of the parameters are the same as the QT GUI Frequency Sink
The Intensity Min and Max will determine how the colormap represents the range of values
