Basic Time Display: Difference between revisions
Jesternofool (talk | contribs) (Added to trigger section, and added sections for actual signals.) |
Jesternofool (talk | contribs) mNo edit summary |
||
| Line 190: | Line 190: | ||
[[File:Aircraft-navigation-signal-ADSB.png|800px]] | [[File:Aircraft-navigation-signal-ADSB.png|800px]] | ||
''Mode S or ADS-B transmission. Such transmissions are roughly 120 usec long. The bursts are modulated using OOK (on-off keying) and encoded using pulse position modulation (PPM). Due to this encoding, when a " | ''Mode S or ADS-B transmission. Such transmissions are roughly 120 usec long. The bursts are modulated using OOK (on-off keying) and encoded using pulse position modulation (PPM). Due to this encoding, when a "01" pattern occurs, it appears that two pulses are actually one. That's the reason that some of the pulses appear higher than the others. This is due to the fact that the RTL-SDR does not have enough bandwidth to separate these bursts.'' | ||
Looking at our original display, we can parse out each of the bursts, annotated as follows: | Looking at our original display, we can parse out each of the bursts, annotated as follows: | ||
Revision as of 01:10, 19 August 2025
Overview
This tutorial will look at the time domain display. This display shows signal amplitude over time. Typically, the amplitude is plotted on the vertical (y) axis and time is plotted on the horizontal (x) axis.
The first time domain display was the oscilloscope (more commonly called the "o-scope" or less commonly the "silly scope").
An older Hewlett-Packard HP120B oscilloscope. On the screen, the vertical axis is amplitude, and the horizontal axis is time. This particular screen is showing a square wave (a signal that is equally high and low). The controls on the top right are the three, primary controls for most time domain displays. These are the vertical (amplitude) controls, the horizontal (time) controls, and the trigger. (Image courtesy of Jeff Peletz. Used with permission.)
The QT GUI Time Sink
Gnu Radio's primary time domain display is the QT GUI Time Sink.
This is a QT GUI Time Sink displaying a sinusoid.
You can create this display yourself in Gnu Radio Companion with the following flowgraph.
A time domain display typically provides controls for three aspects. These are:
- amplitude
- time
- trigger
Amplitude
The amplitude refers to the amount or size of whatever quantity the waveform represents. This can be voltage, current, acceleration, position, or one of many other possibilities.
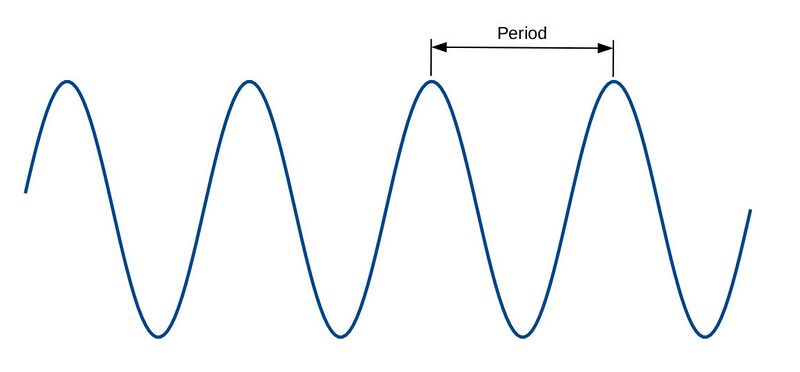
Amplitude is measured in one of two ways; either as the 0-to-peak value or the peak-to-peak value, as shown below.
By default, the time sink defaults to amplitude values from +1 to -1. But what do these values represent? In Gnu Radio, when used with a SDR, it typically refers to the voltage going into the digitizer, but the amplitude will not be calibrated unless the device provides calibrated levels. For most of the inexpensive SDRs that will work with Gnu Radio, the outputs are relative to the maximum number of levels in the digitizer. Again, this is not calibrated.
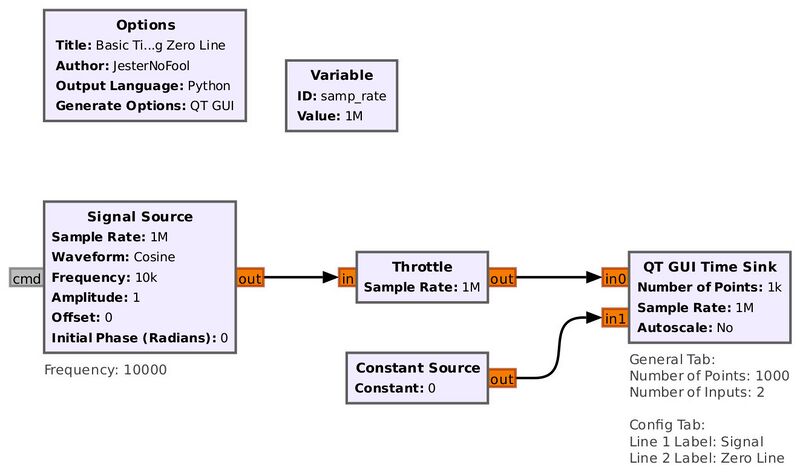
It may be difficult to see the 0 amplitude point on the display. This can be added by adding a second input and using a Constant Source. This is shown in this flowgraph:
Flowgraph to add a zero line to the QT GUI Time Sink.
Display from the flowgraph showing a zero line added to the time sink.
Measuring Time
The timing is based on the sample rate provided in the time sink properties. The provided sample rate has no affect on the performance of the time sink. The time sink is doing nothing more than plotting the sample amplitudes sequentially. The provided sample rate is used to plot the sample period in sequentially ascending order. This can be used to measure the timing aspects of a waveform. For example, it can be used to measure the period of a periodic waveform. The period is the measurement of time for one repetition of a periodic waveform. For a sinusoid, that would be one cycle, as shown below.
This shows how to measure the period of a periodic signal. Simply pick a point, then continue along the signal until it starts to repeat. The difference in time between these two points is the period.
Looking at the first sinewave display, we can measure the period as follows:
The sample rate for this display was 1 MSam/s (1 million samples per second). Using this to measure the period, it turns out to be 100 usec.
Period and frequency are inversely related. This means you can calculate the frequency of a sinusoid by taking the inverse of the period.
where:
- f = frequency
- T = period of waveform
Thus, the frequency of this sinewave is 1/(100 usec) = 10,000 Hz = 10 kHz. This matches the frequency we had in the Signal Source block.
Conversely, if you know the frequency of a sinusoid (or any periodic waveform), you can calculate the period as:
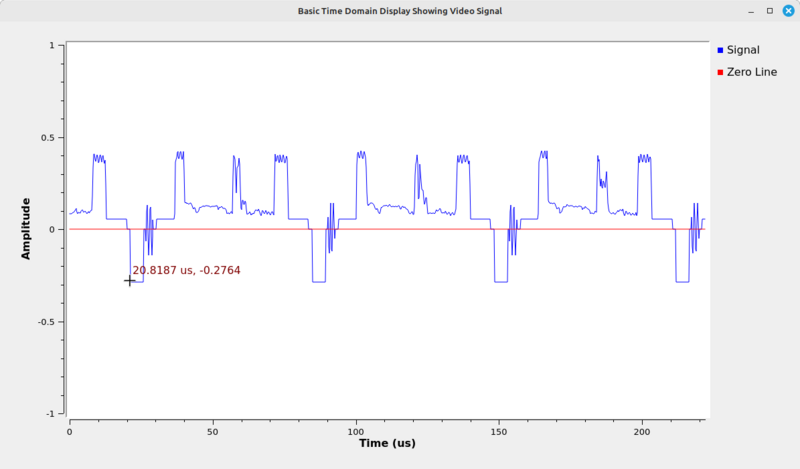
Let's take a look at an actual signal to see how this works. We'll use an older analog video signal based on the NTSC (National Television System Committee) standard. The video signal comes from using hacktv to create a digitized, analog video signal using the NTSC standard. This is a baseband (unmodulating) video signal. This is the flowgraph that will display this baseband video signal.
Running the flowgraph, we get the display shown below:
You can place your cursor over any part of the time domain display and it will provide the time and amplitude at that point. By center-clicking on the display while it is running, a pop-up menu provides an option to "Stop" the display. Doing so, we can now measure the timing of the signal, as shown below:
This shows the cursor time as 20.8187 usec. Moving the cursor to the next pulse over, we get the following:
The cursor shows the time value of 84.6784 usec. Taking the difference between these two values, we get 84.6784 - 20.8187 = 63.8597 usec. The timing for a line of video in the NTSC standard is 63.556 usec. This is pretty close to that value, which is what we would expect.
Oscilloscopes control the timing of the display either by setting the total time span of the display, or by setting the time per division. The QT GUI Time Sink does this by setting the Number of Points. The greater the number of points displayed, the longer the time that will be displayed. For example, looking at the video signal from earlier, we were only looking at a few lines of the video. But what if we wanted to see a full field of video? The field rate for NTSC signals is roughly 60 Hz, so one field is 16.67 msec (1/60 Hz). We can double this to 33 msec ensure we have at least one full frame in the display. We can calculate the required number of points for this with the following calculation:
where: N = the number of points to be displayed. fs = sample rate (which GRC typically labels as "samp_rate"). t = the amount of time desired on the display.
In the example above, the number of points needed to display 33 msec given the sample rate of 4.5 MHz would be (33e-3)(4.5e6) = 148500. Putting that into the Number of Points in the properties of the time sink, then running the flowgraph, we get an image similar to that below.
This display allows us to measure the field rate of the video. In this case, the value is roughly 16.67 msec. This corresponds to a NTSC video. If it were PAL or SECAM, we would measure roughly 20 msec.
Trigger Control
If you created the original flowgraph generating a sinewave, you may have noticed that the sinewave did not appear to move. That's due to how the time sink processes samples. We used a sample rate of 1 MHz and a sinewave frequency of 10 kHz. This corresponds to (1 MHz)/(10 kHz) = 100 samples per cycle. The Number of Points in the display is an integer multiple of 100 (1000 points). Thus, when it draws a display and begins the next one, it's at the same point on the sinewave.
There's a calculation you can do to determine if you have an integer number of cycles based on the sample rate, signal frequency and number of points in the display. The calculation is:
where:
fc = frequency of signal
N = number of points on display
fs = sample rate
If you change any of these parameters such that the final number is not an integer and run the flowgraph, you will notice that the waveform appears to move. This is because we're no longer drawing an integer number of cycles in the display. The display will start at a different point on the waveform; hence, the waveform appears to move. It's not moving. The display is unstable.
Which creates a problem for the time domain display. If we control the input frequency, then we can make the signal equal to an integer number of cycles. But that's not always possible. Therefore, we need another way to stabilize the signal. That method is triggering.
The concept of triggering means to start the display of the waveform based on a certain attribute. The most common trigger method uses a certain amplitude of the waveform, and a slope of that signal. For example, looking at a sinewave that varies between +1 to -1, it will pass through 0 twice with each cycle. One time it will be going from negative to positive (positive slope), and the other going from positive to negative (negative slope). This is shown in the image below.
Time domain display showing two trigger points, one for a positive slope (left) and negative slope (right).
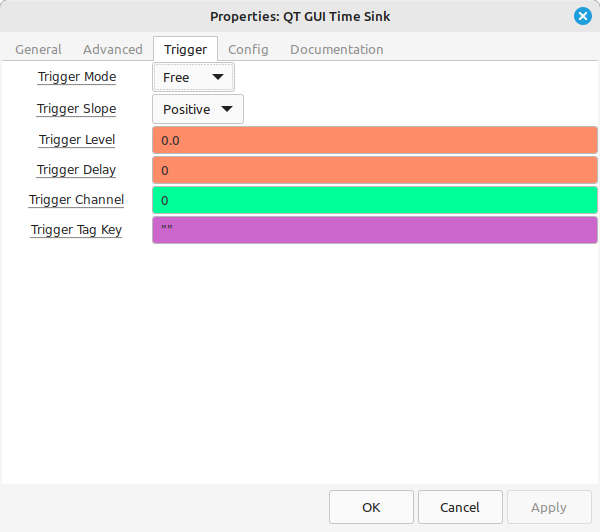
The trigger controls for the QT GUI Time Sink are available, appropriately enough, using the Trigger tab under the time sink's properties.
Trigger properties under the Trigger tab of the QT GUI Time Sink.
The default for the QT GUI Time Sink is for the trigger to be Free. This corresponds to no trigger, and the time display will update as fast as either the update period or the sample rate combined with the number of points to be displayed. To set the trigger based on an amplitude and slope, we'll set it to "Normal".
We'll use our basic Gnu Radio flowgraph to look at how the trigger stabilizes the signal.
Flowgraph that will create an unstable time domain display.
Running this flowgraph will create an image similar to that below:
If we change the trigger to "Normal", the sinewave will be (mostly) stabilized.
Time domain display in which the trigger has been set to "Normal".
Note that there's still a little bit of jitter. The stability of the display is based on the samples per cycle of the waveform. If the number of cycles is not an integer, then you'll see some jitter.
Looking at Actual Signals
Modern commercial aircraft (and many private aircraft) now carry transceivers and transponders that allow them to transmit and receive signals related to aircraft navigation. These include ADS-B (Automatic Dependent Surveillance - Broadcast) and Mode A/C/S replies to radar interrogation. Aircraft transmit these signals on 1090 MHz. Mode A, Mode C, and Mode S signals are responses to interrogation from radars. The radars transmit on 1030 MHz (1.03 GHz), and the aircraft respond on 1090 MHz (1.09 GHz). Along with this, ADS-B transmitters also transmit periodically on the same 1090 MHz.
Such transmissions are modulated onto the carrier using on-off keying (OOK), a form of amplitude modulation (AM). OOK is a form of AM that is double sideband, full carrier (DSB-FC) AM. Mode S and ADS-B transmissions are further encoded using pulse position modulation (PPM). To look at these signals
To look at these signals, we'll use the following flowgraph:
Flowgraph to receive Mode A/C/S and ADS-B aircraft navigation signals using a RTL-SDR. Because the modulation is OOK, a form of DSB-FC, the most basic demodulator is a Complex to Mag block. NOTE: The RF gain of the RTL-SDR is set to its maximum (~50), but this may need to be adjusted lower if the signals are too strong.
Running this flowgraph, we get a display similar to that below:
Display of the QT GUI Time Sink from the aircraft navigation flowgraph. This shows several bursts of Mode A/C/S and ADS-B transmissions.
We can freeze this display at any time by right-clicking on the display and selecting "Stop" from the top of the pop-up menu. We can then click-and-drag a box around any of these signals to zoom in on them. For example, here is an example of a Mode A/C signal.
Time domain display of a Mode A or Mode C transmission. The signal was captured at 2.4 MHz using a RTL-SDR, then upsampled to 24 MHz to smooth out the time domain display.
Here is an example of a Mode S or ADS-B transmission.
Mode S or ADS-B transmission. Such transmissions are roughly 120 usec long. The bursts are modulated using OOK (on-off keying) and encoded using pulse position modulation (PPM). Due to this encoding, when a "01" pattern occurs, it appears that two pulses are actually one. That's the reason that some of the pulses appear higher than the others. This is due to the fact that the RTL-SDR does not have enough bandwidth to separate these bursts.
Looking at our original display, we can parse out each of the bursts, annotated as follows:
Time domain display of aircraft navigation signals annotated.
Measuring FM Signal Deviation
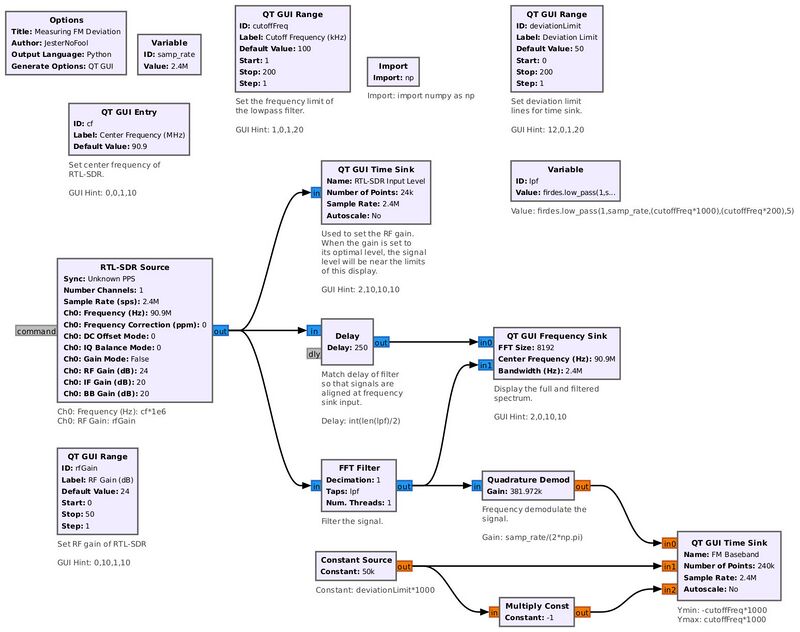
We can use Gnu Radio to measure the deviation of a FM signal. The Quadrature Demod block provides a basic frequency discriminator, specifically using a polar discriminator, to frequency demodulate a FM signal. With the gain set to (sample rate)/(2*pi), the output maximum amplitudes will be based on the deviation of the signal. The flowgraph demonstrated here is as follows:
Flowgraph to measure the deviation of a FM signal. This flowgraph uses the RTL-SDR. For that reason, the output of the SDR is sent to a QT GUI Time Sink in order to set the RF gain. (NOTE: This only works with 8-bit digitizer SDRs, such as the RTL-SDR and the HackRF One.) The output is filtered, frequency demodulated, and the demodulated output is sent to a second time sink to actually measure the deviation. The deviation limit is determined using the "Deviation Limit" lines, controlled by a range variable.
Running this flowgraph and testing it with a FM broadcast station, we get an image similar to that below:
Display measuring the deviation of a FM broadcast signal in the US. Such signals have deviations from 75 - 82 kHz, depending on the specific signal. This measured roughly 77 kHz.
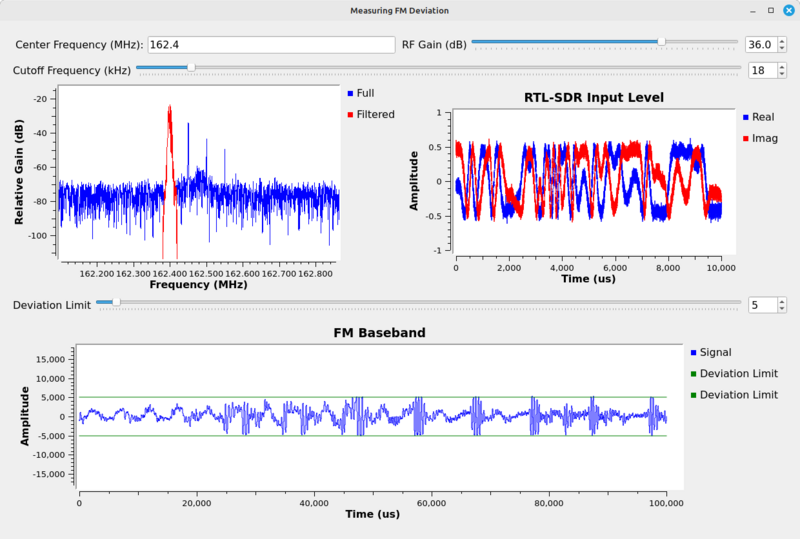
Changing the frequency to a US NOAA Weather Radio (NWR), we got the following:
Display measuring the deviation of a US NWR signal. The deviation is approximately 5 kHz.


