QT GUI Number Sink: Difference between revisions
(Created page with "Category:Block Docs Category:Stub Docs This is the template for the "Page-per-block Docs". This first section should describe what the block...") |
(add example flowgraph) |
||
| (One intermediate revision by one other user not shown) | |||
| Line 1: | Line 1: | ||
[[Category:Block Docs]] | [[Category:Block Docs]] | ||
Displays the data stream in as a number in a simple text box GUI along with an optional bar graph. | |||
The displayed value can be the average of the input stream, in which case all items received are averaged. If not averaging, the display simply samples a value in the data stream based on the update time of this block. | |||
Note that due to a flaw in the implementation, this block cannot receive integer value inputs. It will take chars, shorts, and floats and properly convert them by setting itemsize of the constructor to one of these three values (sizeof_char, sizeof_short, and sizeof_float, respectively). If using integers, the block treats these as floats. Instead, put the integer input stream through an [[Int To Float]] block. | |||
== Parameters == | == Parameters == | ||
(''R''): <span class="plainlinks">[https://wiki.gnuradio.org/index.php/GNURadioCompanion#Variable_Controls ''Run-time adjustable'']</span> | (''R''): <span class="plainlinks">[https://wiki.gnuradio.org/index.php/GNURadioCompanion#Variable_Controls ''Run-time adjustable'']</span> | ||
; | ; Name | ||
: | : Name of the display | ||
; Autoscale | |||
: | |||
; Average | |||
: Averaging coefficient (0 - 1) | |||
; | ; Graph Type | ||
: | : The bar graph can be set to horizontal (NUM_GRAPH_HORIZ), vertical (NUM_GRAPH_VERT), or no graph (NUM_GRAPH_NONE). | ||
; Number of Inputs | |||
: Number of signals connected to sink | |||
; Min | |||
: | |||
; Max | |||
: | |||
; Update Period (''R'') | |||
: | |||
; GUI Hint | |||
: See [[GUI Hint]] for info about how to organize multiple QT GUIs | |||
; Line Label | |||
: | |||
; Line Unit | |||
: | |||
; Line Color | |||
: | |||
; Line Factor | |||
: | |||
== Example Flowgraph == | == Example Flowgraph == | ||
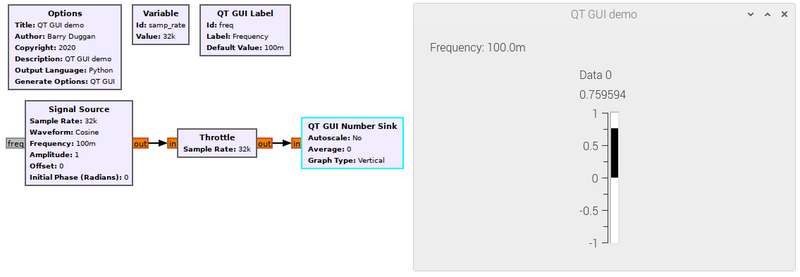
This flowgraph and output show a QT_GUI_Number_Sink. The output shows the instantaneous value of the Signal Source along with a bar graph of that value. | |||
[[File:QT_GUI_demo.png|800px]] | |||
== Source Files == | == Source Files == | ||
; C++ files | ; C++ files | ||
: [https://github.com/gnuradio/gnuradio | : [https://github.com/gnuradio/gnuradio/blob/master/gr-qtgui/lib/number_sink_impl.cc] | ||
; Header files | ; Header files | ||
: [https://github.com/gnuradio/gnuradio | : [https://github.com/gnuradio/gnuradio/blob/master/gr-qtgui/lib/number_sink_impl.h] | ||
; Public header files | ; Public header files | ||
: [https://github.com/gnuradio/gnuradio | : [https://github.com/gnuradio/gnuradio/blob/master/gr-qtgui/include/gnuradio/qtgui/number_sink.h] | ||
; Block definition | ; Block definition | ||
: [https://github.com/gnuradio/gnuradio | : [https://github.com/gnuradio/gnuradio/blob/master/gr-qtgui/grc/qtgui_number_sink.block.yml] | ||
Latest revision as of 22:18, 19 April 2020
Displays the data stream in as a number in a simple text box GUI along with an optional bar graph.
The displayed value can be the average of the input stream, in which case all items received are averaged. If not averaging, the display simply samples a value in the data stream based on the update time of this block.
Note that due to a flaw in the implementation, this block cannot receive integer value inputs. It will take chars, shorts, and floats and properly convert them by setting itemsize of the constructor to one of these three values (sizeof_char, sizeof_short, and sizeof_float, respectively). If using integers, the block treats these as floats. Instead, put the integer input stream through an Int To Float block.
Parameters
(R): Run-time adjustable
- Name
- Name of the display
- Autoscale
- Average
- Averaging coefficient (0 - 1)
- Graph Type
- The bar graph can be set to horizontal (NUM_GRAPH_HORIZ), vertical (NUM_GRAPH_VERT), or no graph (NUM_GRAPH_NONE).
- Number of Inputs
- Number of signals connected to sink
- Min
- Max
- Update Period (R)
- GUI Hint
- See GUI Hint for info about how to organize multiple QT GUIs
- Line Label
- Line Unit
- Line Color
- Line Factor
Example Flowgraph
This flowgraph and output show a QT_GUI_Number_Sink. The output shows the instantaneous value of the Signal Source along with a bar graph of that value.
Source Files
- C++ files
- [1]
- Header files
- [2]
- Public header files
- [3]
- Block definition
- [4]
