QT GUI Matrix Sink: Difference between revisions
Jump to navigation
Jump to search
(Created page with "Category:Block Docs This is a QT-based graphical sink that plots 2D matrix of data as a color plot. The data is displayed in a window with a color bar on the right side. The color bar shows the mapping of data values to colors. The color bar can be used to change the range of data values that are displayed. == Parameters == (''R''): <span class="plainlinks">[https://wiki.gnuradio.org/index.php/GNURadioCompanion#Variable_Controls ''Run-time adjustable'']</span> ; N...") |
No edit summary |
||
| (One intermediate revision by the same user not shown) | |||
| Line 63: | Line 63: | ||
; C++ files | ; C++ files | ||
: [https://github.com/gnuradio/gnuradio/blob/master/gr-qtgui/lib/matrix_sink_impl.cc] | : [https://github.com/gnuradio/gnuradio/blob/master/gr-qtgui/lib/matrix_sink_impl.cc matrix_sink_impl.cc] | ||
; Header files | ; Header files | ||
: [https://github.com/gnuradio/gnuradio/blob/master/gr-qtgui/lib/matrix_sink_impl.h] | : [https://github.com/gnuradio/gnuradio/blob/master/gr-qtgui/lib/matrix_sink_impl.h matrix_sink_impl.h] | ||
; Public header files | ; Public header files | ||
: [https://github.com/gnuradio/gnuradio/blob/master/gr-qtgui/include/gnuradio/qtgui/matrix_sink.h] | : [https://github.com/gnuradio/gnuradio/blob/master/gr-qtgui/include/gnuradio/qtgui/matrix_sink.h matrix_sink.h] | ||
; Block definition | ; Block definition | ||
: [https://github.com/gnuradio/gnuradio/blob/master/gr-qtgui/grc/qtgui_matrix_sink.block.yml] | : [https://github.com/gnuradio/gnuradio/blob/master/gr-qtgui/grc/qtgui_matrix_sink.block.yml qtgui_matrix_sink.block.yml] | ||
Latest revision as of 19:37, 23 June 2023
This is a QT-based graphical sink that plots 2D matrix of data as a color plot. The data is displayed in a window with a color bar on the right side. The color bar shows the mapping of data values to colors. The color bar can be used to change the range of data values that are displayed.
Parameters
(R): Run-time adjustable
- Name
- Title for the plot
- Vector Size
- Vector length at input
- Number of Columns
- Number of columns to be made from input vector to represent as matrix.
- Contour Plot
- Contour Plot enables or disables the contour plot visualization mode. When set to true, the matrix data will be displayed as contour plots in the GUI.
- Color Map
- Color Map defines the color scheme used for visualizing the matrix data.
- Interpolation
- Interpolation determines the method used to interpolate between matrix elements for smoother visualization.
- X-Axis Start Value (R)
- X-Axis Start Value sets the starting value of the x-axis range in the GUI.
- X-Axis End Value (R)
- X-Axis End Value sets the ending value of the x-axis range in the GUI.
- Y-Axis Start Value (R)
- Y-Axis Start Value sets the starting value of the y-axis range in the GUI.
- Y-Axis End Value (R)
- Y-Axis End Value sets the ending value of the y-axis range in the GUI.
- Z-Axis Minimum Value (R)
- Z-Axis Minimum Value sets the minimum value of the z-axis range in the GUI. It determines the lower bound of the color mapping for the matrix data.
- Z-Axis Maximum Value (R)
- Z-Axis Maximum Value sets the maximum value of the z-axis range in the GUI. It determines the upper bound of the color mapping for the matrix data.
- X-Axis Label
- The X-Axis label
- Y-Axis Label
- The Y-Axis label
- Z-Axis Label
- The Z-Axis label
- GUI Hint
- See GUI Hint for info about how to organize multiple QT GUIs
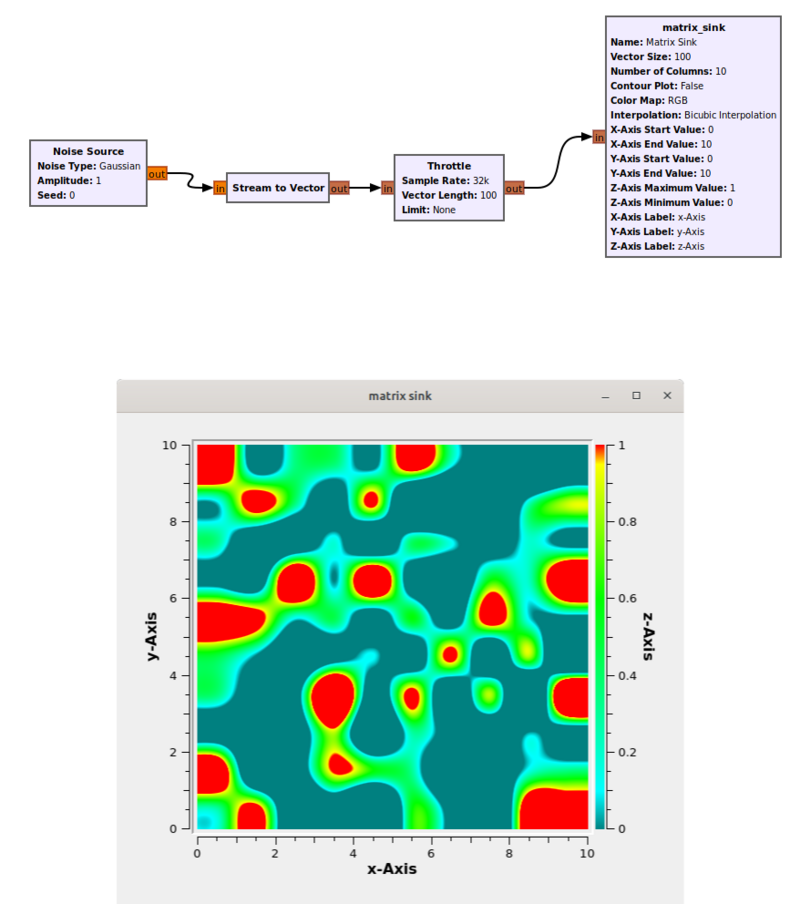
Example Flowgraph
This flowgraph and output was produced by https://github.com/gnuradio/gnuradio/blob/master/gr-qtgui/examples/qtgui_matrix_sink_example.grc
Source Files
- C++ files
- matrix_sink_impl.cc
- Header files
- matrix_sink_impl.h
- Public header files
- matrix_sink.h
- Block definition
- qtgui_matrix_sink.block.yml
