QT GUI Histogram Sink
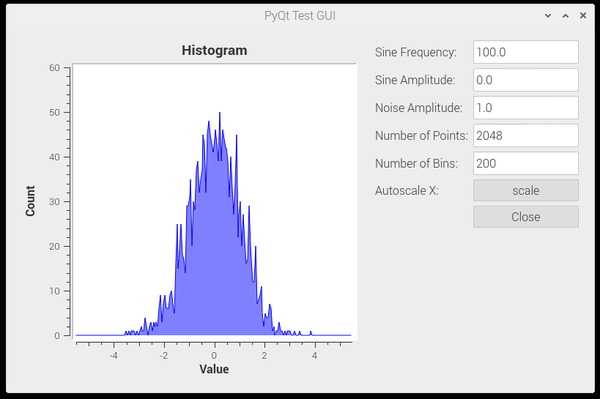
This is a QT-based graphical sink that displays a histogram of the data.
This histogram allows you to set and change at runtime the number of points to plot at once and the number of bins in the histogram. Both x and y-axis have their own auto-scaling behavior. By default, auto-scaling the y-axis is turned on and continuously updates the y-axis max value based on the currently plotted histogram.
The x-axis auto-scaling function only updates once when clicked. This resets the x-axis to the current range of minimum and maximum values represented in the histogram. It resets any values currently displayed because the location and width of the bins may have changed.
This sink can plot messages that contain either uniform vectors of float 32 values (pmt::is_f32vector) or PDUs where the data is a uniform vector of float 32 values.
Parameters
(R): Run-time adjustable
- Name
- Title for the plot
- Number of Points
- Number of points to plot at once
- Number of Bins (R)
- Number of bins to sort the data into
- Grid
- Autoscale
- Accumulate
- Accumulates the data between calls to work. When accumulate is activated, the y-axis autoscaling is turned on by default as the values will quickly grow in the this direction.
- Min x-axis (R)
- Minimum x-axis value
- Max x-axis (R)
- Maximum x-axis value
- Number of Inputs
- Number of signals connected to sink
- Update Period (R)
- GUI Hint
- See GUI Hint for info about how to organize multiple QT GUIs
- Grid
- Legend
- Axis Labels
- Line 1 Label
- Line 1 Width
- Line 1 Color
- Line 1 Style
- Line 1 Marker
- Line 1 Alpha
Example Output
This output was produced by https://github.com/gnuradio/gnuradio/blob/master/gr-qtgui/examples/pyqt_histogram_f.py
Source Files
- C++ files
- [1]
- Header files
- [2]
- Public header files
- [3]
- Block definition
- [4]
