QT GUI Time Raster Sink
This is a QT-based graphical sink that takes in numerical streams and plots a time_raster (spectrogram) plot.
This sink can plot messages that contain either uniform vectors of float 32 values (pmt::is_f32vector) or PDUs where the data is a uniform vector of float 32 values.
Note: This block does not limit the items per second it consumes, even though it has an "Update Rate" parameter; it will drop samples if the incoming data rate is higher than the product of the number of columns and the update rate. It is up to the user to choose an update rate that represents his processing needs.
Parameters
(R): Run-time adjustable
- Name
- Title for the plot
- Sample Rate
- Sample rate of signal
- Num. Rows (R)
- Number of rows to plot
- Num. Cols (R)
- Number of cols to plot
- Grid
- Int. min
- Int. max
- Multiplier (R)
- Vector of floats as a scaling multiplier for each input stream
- Offset (R)
- Vector of floats as an offset for each input stream
- Number of Inputs
- Number of streams connected
- Update Period (R)
- GUI Hint
- See GUI Hint for info about how to organize multiple QT GUIs
- Axis Labels
- Line Label
- Line Color
- Line Alpha
- X-Axis Label, X-Axis Start Value, X-Axis End Value, Y-Axis Label, Y-Axis Start Value, Y-Axis End Value (New as of 3.9)
- Allows the Time Raster to be able to look like a QT GUI Waterfall Sink if desired
Example Flowgraph
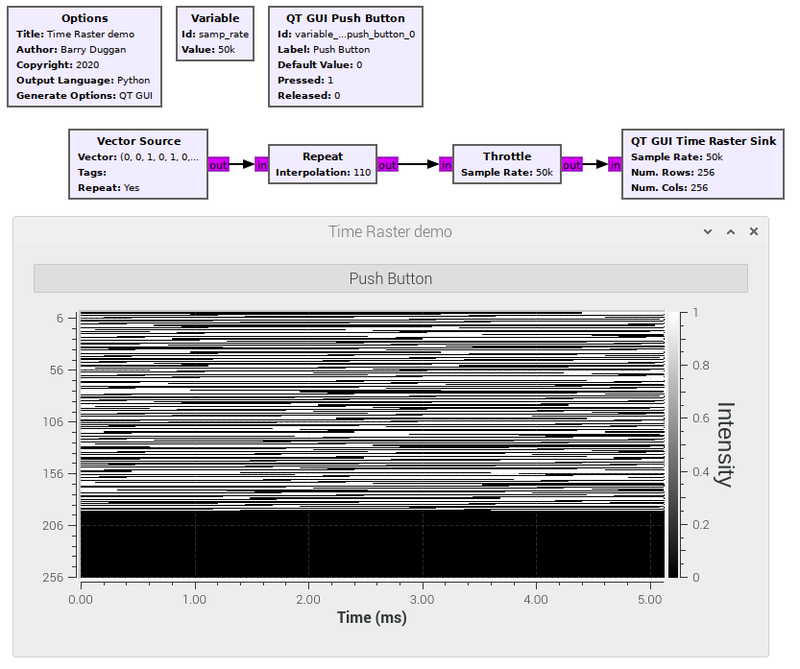
This flowgraph and output show a QT GUI Time Raster Sink.
Interactive Demo
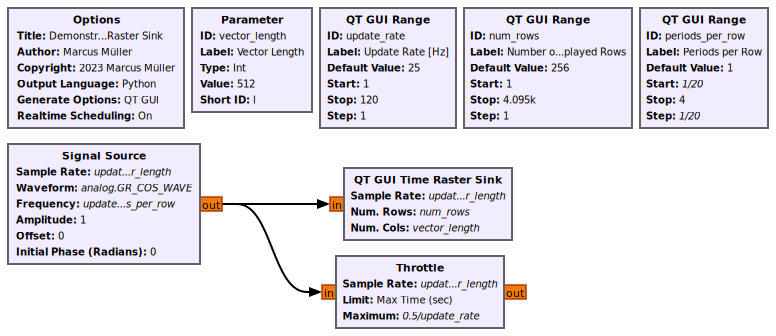
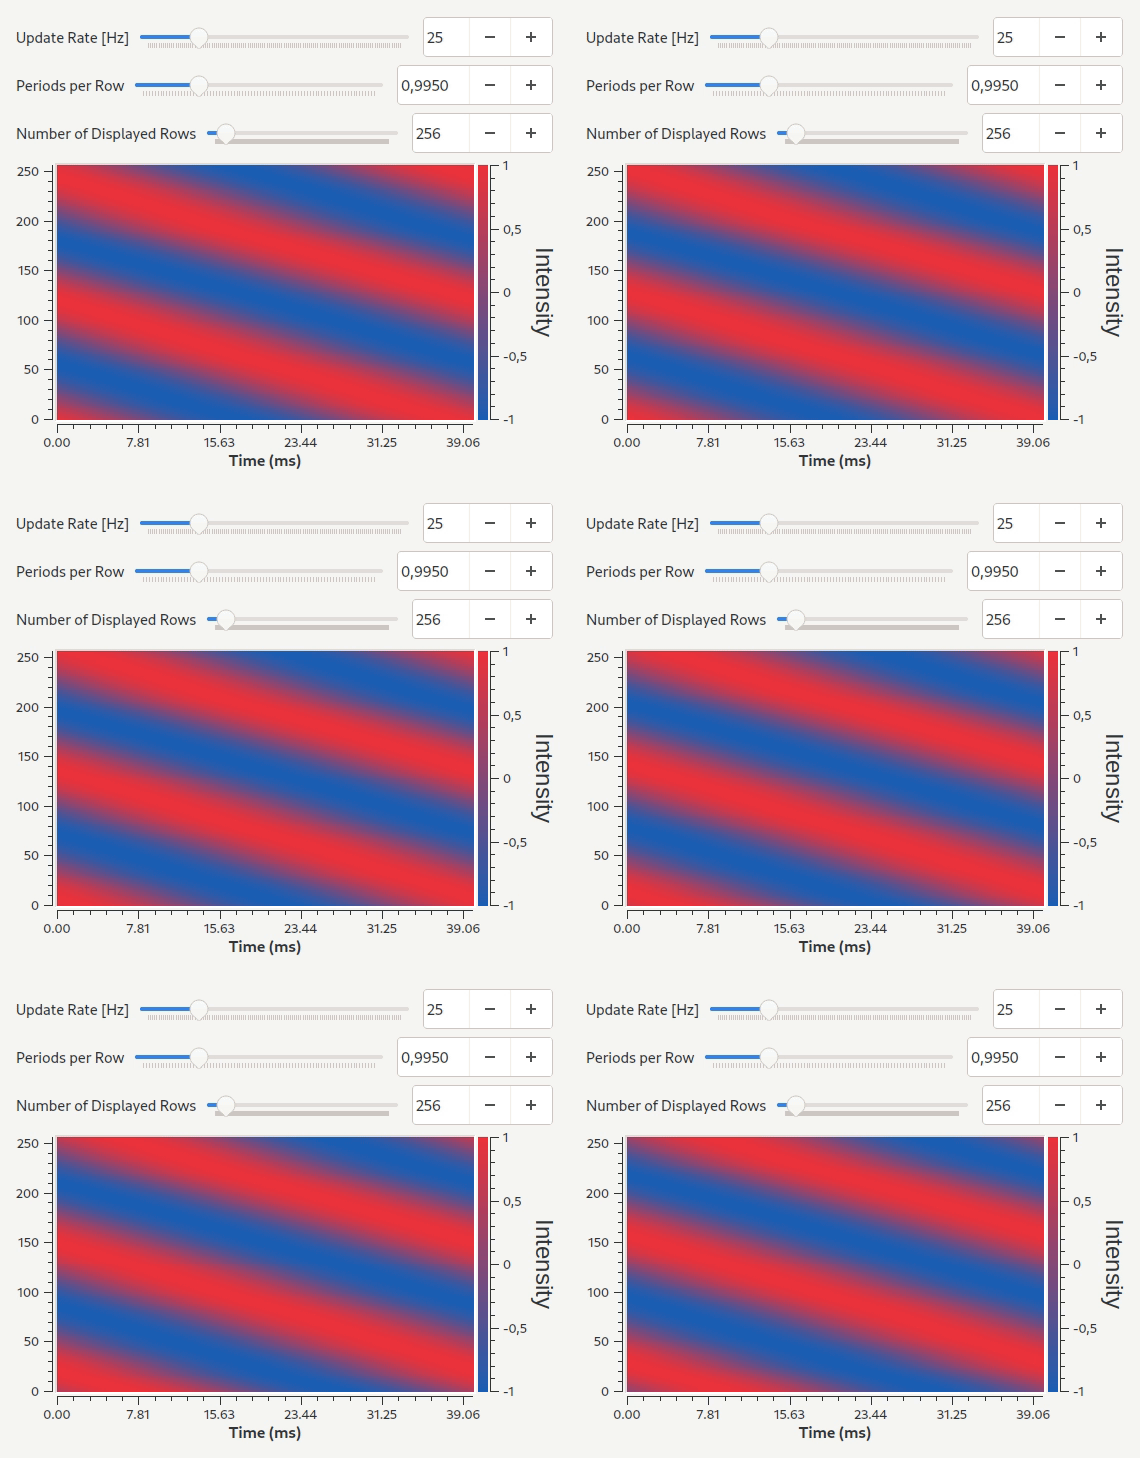
This flowgraph shows how to adjust processing rate in a pure simulation flow graph using the new-style Throttle block.
Source Files
- C++ files
- Float input
- Bit input
- Header files
- Float input
- Bit input
- Public header files
- Float input
- Bit input
- Block definition
- [1]


