UsingVSCode
Prerequisites
Tools used in this tutorial:
- GNU Radio v3.10 or newer
- Visual Studio Code or VSCodium
The following instructions have been tested with GNU Radio v3.10.9 and VSCodium v1.92 in Ubuntu 24.04 LTS.
Extensions for VSCode users
- "Python" - for working with Python code and debugging it;
- "C/C++" - for working with C++ code and debugging it;
- "CMake Tools" - for working with the CMake project, using tasks to configure, build and test it;
- "GNU Radio Integration" - for working with GNU Radio modules, an interface to gr_modtool;
- "YAML" - for working with GRC files manually.
Extensions for VSCodium users
- "Python" - for working with Python code and debugging it;
- "clangd" - language server for working with C++ code;
- "CodeLLDB" or "Native Debug" - for debugging C++ code;
- "CMake Tools" - for working with the CMake project, using tasks to configure, build and test it;
- "GNU Radio Integration" - for working with GNU Radio modules, an interface to gr_modtool;
- "YAML" - for working with GRC files manually.
Extension pack
To get the extensions for editing, you can install "GNU Radio development pack" (VSCode, VSCodium).
You will still need to install "CMake Tools" and all C++ extensions separately.
Setting up for editing GNU Radio modules
"GNURadio Integration" extension provides a graphical interface to gr_modtool within VSCode. It allows you to:
- Create new OOT modules;
- Query information about the module;
- Discover the module's blocks in the OOT Module Explorer;
- Add, rename and remove blocks;
- Create or update Python bindings to C++ blocks;
- Update XML block definitions to YAML.
Additionaly, you can:
- Launch GNURadio Companion from the command palette;
- Open the current GRC flowgraph file in GNURadio Companion;
- Compile the current GRC flowgraph into an application;
- Run the current GRC flowgraph.
To properly set up the development environment, follow the procedure:
Step 1: Discover GNURadio
GNURadio can be installed system-wide (with the distribution's package manager, e.g. apt) or locally. You can check the installation prefix with "gnuradio-config-info --prefix" command.
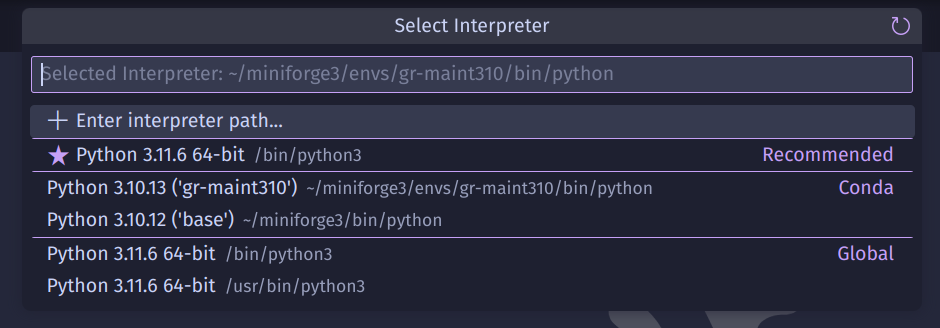
For Conda-based installations the prefix is related to the virtual environment, so it can be discovered using "Select Interpreter" command of the "Python" extension:
If there is a specific Python interpreter or environment you would like to use by default, you can specify Default interpreter and Default PYTHONPATH in the Settings.
In Linux, the default system-wide install prefix is /usr, but it can be defined by the user in source builds (default: /usr/local). In native Windows builds, the install prefix is always user-defined. To provide the editor with the required path to use GNURadio scripts, you will need to specify GNURadio Prefix in the Settings.
Step 2: Open the module's directory
You can create a new OOT module from VSCode using Create OOT Module command. It will prompt you for a name for the new module, and then prompt you to select the directory, in which the new module project will be created. For example, if you enter "sample" as the name and select ~/Documents as the location, the module project will be created in ~/Documents/sample. After that, the editor will ask if you want to open this module's directory in the current editor.
Alternatively, modules can be created with gr_modtool (see Creating an OOT Module). You can open their directories manually, using Open Directory command (Ctrl+K -> Ctrl+O). The same is applicable to existing OOT modules.
Step 3: Use the Module Explorer
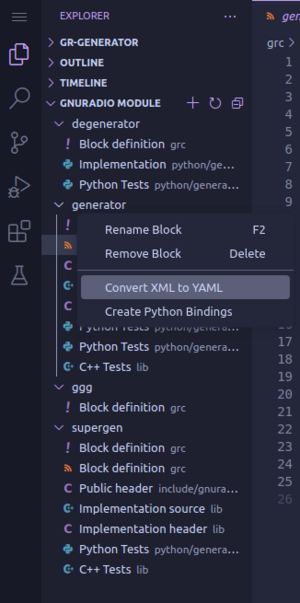
If an OOT module is detected in the workspace, the GNURadio Module tree view will appear in the Explorer container in the sidebar. All blocks within that module are presented with the corresponding files:
- YAML GRC block definition;
- Python implementation source or Python blocks;
- C++ header and implementation source for C++ blocks;
- Python and C++ QA (unit testing) source files.
Click the "+" button in the Module Explorer header to create a new block. The "Refresh" button is used to refresh the view after external changes.
Context menus (Right mouse click) for blocks contain the module manipulation commands:
- Rename block;
- Remove block;
- Convert XML to YAML (if XML definition is present);
- Create Python bindings (if the block's source code is C++).
Step 4: Edit the module's source code
Related tutorials: Creating Your First Block, Creating Python OOT with gr-modtool, Creating C++ OOT with gr-modtool.
To enable syntax highlighting, autocompletion, documentation and other code editing features, you need to install the language server extension for the corresponding language:
- For Python, install "Python" extension.
- For C++, install "C/C++" or "clangd" extension.
Step 5: Build and test the module
You can build and install the module using CMake either from a terminal or with "CMake Tools" extension. Build flags can be set in the command line or in build/CMakeCache.txt.
You can perform unit testing for your blocks with QA functions (python/module/qa_block.py, lib/qa_block.cc). Testing panel provides an overview of all test fixtures in the module.
After installing the module you can use your blocks in flowgraphs. It is considered a good practice to add examples for your module to demonstrate the usage of your blocks. Example flowgraphs can also be used for #Source level debugging.
Step 6 (Optional): Use additional features
Some features of "GNURadio Integration" require presence of other extensions.
- "Python" extension is required to discover GNURadio installation in a Python virtual environment using "Select Interpreter" command.
- "YAML" extension is required to use syntax highlighting and validation in GRC flowgraph files and YAML GRC block definition files.
- "YAML Embedded Languages" extension can provide additional highlighting for embedded code blocks (e.g. "make" templates).
Source level debugging
The procedure described below allows source level debugging within VSCode through the use of the module's QA functions or flowgraphs. A debugger extension is required (see #Extensions for VSCode users and #Extensions for VSCodium users).
To debug your blocks using flowgraphs:
- Configure, build and install it using CMake;
- Be sure to set build type to "Debug" at the configure step as a cache variable (build/CMakeCache.txt) or as a CMake command flag:
cmake .. -DCMAKE_BUILD_TYPE=Debug
- Be sure to set build type to "Debug" at the configure step as a cache variable (build/CMakeCache.txt) or as a CMake command flag:
- Create and compile a flowgraph that uses your module;
- Run the compiled flowgraph with a debugger.
Launching from VSCode
The simplest way to achieve source level debugging is to launch the top level flowgraph from VSCode. To do that:
- Set breakpoints in code that you want to hit.
- In the Debug panel (Ctrl-Shift-D), create a launch configuration;
- Create a configuration with "request": "launch";
- Set "type" according to the target block type:
- "debugpy" for Python blocks;
- "cppdbg" for C++ blocks with "C/C++" extension;
- "lldb" for C++ blocks with "CodeLLDB" extension;
- "gdb", "lldb-mi" or "mago-mi" for C++ blocks with "Native Debug" extension;
- Set "program" as your Python interpreter, e.g. "/usr/bin/python3";
- Set "args" as your compiled flowgraph:
["-u", "/path/to/flowgraph.py"]; - Alternatively, if your flowgraph compiles to C++, set "program" as your compiled and built flowgraph: "/path/to/flowgraph/build/flowgraph".
- Complete launch.json example:
{
    "version": "0.2.0",
    "configurations": [
        {
            "name": "(gdb) Launch",
            "type": "cppdbg",
            "request": "launch",
            "program": "/usr/bin/python3",
            "args": ["-u", "/path/to/flowgraph.py"],
            "stopAtEntry": false,
            "cwd": "${workspaceFolder}",
            "environment": [],
            "externalConsole": false,
            "MIMode": "gdb",
            "setupCommands": [
                {
                    "description": "Enable pretty-printing for gdb",
                    "text": "-enable-pretty-printing",
                    "ignoreFailures": true
                }
            ]
        },
    ]
}
- Start a debugging session with "Debug: Start Debugging" command (F5).
- The debugger will then land on your breakpoints.
Attaching to Process
Another alternative is to attach to an already running process. This is useful for more complicated long-running systems and flowgraphs. To do that:
- Set breakpoints in code that you want to hit.
- In the Debug panel (Ctrl-Shift-D), create a launch configuration;
- Create a configuration with "request": "attach";
- Set "type" according to the target block type:
- "debugpy" for Python blocks;
- "cppdbg" for C++ blocks with "C/C++" extension;
- "lldb" for C++ blocks with "CodeLLDB" extension;
- "gdb", "lldb-mi" or "mago-mi" for C++ blocks with "Native Debug" extension;
- Set "program" as your Python interpreter, e.g. "/usr/bin/python3";
- Set "processId" as "${command:pickProcess}" to pick from a list of running Python processes;
- Complete launch.json example:
{
    "version": "0.2.0",
    "configurations": [
        {
            "name": "(gdb) Attach",
            "type": "cppdbg",
            "request": "attach",
            "program": "/usr/bin/python3",
            "processId": "${command:pickProcess}",
            "MIMode": "gdb",
            "setupCommands": [
                {
                    "description": "Enable pretty-printing for gdb",
                    "text": "-enable-pretty-printing",
                    "ignoreFailures": true
                }
            ]
        },
    ]
}
- Launch your flowgraph from a terminal;
- If necessary, delay the startup in code (e.g. by adding
sleeporraw_inputand give the debugger time to attach:
 if __name__ == "__main__":
     if GDB_ATTACH:
         print(f"Blocked waiting or GDB attach (pid = {os.getpid()}). "
               "Press ENTER after GDB is attached.", flush=True)
         raw_input()
     main()
- If necessary, delay the startup in code (e.g. by adding
- Start a debugging session with "Debug: Start Debugging" command (F5).
- You will be prompted to select the process to attach to; type "python" to filter Python instances and select the one running your flowgraph.
- The debugger will then attach and land on your breakpoints.

