QT GUI Vector Sink
Jump to navigation
Jump to search
This is a QT-based graphical sink that plots vectors of data as-is. Each signal is plotted with a different color.
Parameters
(R): Run-time adjustable
- Name
- Title for the plot
- Vector Size
- Vector length at input
- X-Axis Start Value (R)
- The x-Axis value of the first vector element
- X-Axis Start Value (R)
- The step with which x-Axis values increment
- X-Axis Label
- The X-Axis label
- Y-Axis Label
- The Y-Axis label
- X-Axis Units (R)
- Y-Axis Units (R)
- Ref Level (R)
- Grid
- Autoscale
- Average
- Y min (R)
- Y max (R)
- Number of Inputs
- Number of signals connected to sink
- Update Period (R)
- GUI Hint
- See GUI Hint for info about how to organize multiple QT GUIs
- Show Msg Ports
- Line 1 Label
- Line 1 Width
- Line 1 Color
- Line 1 Alpha
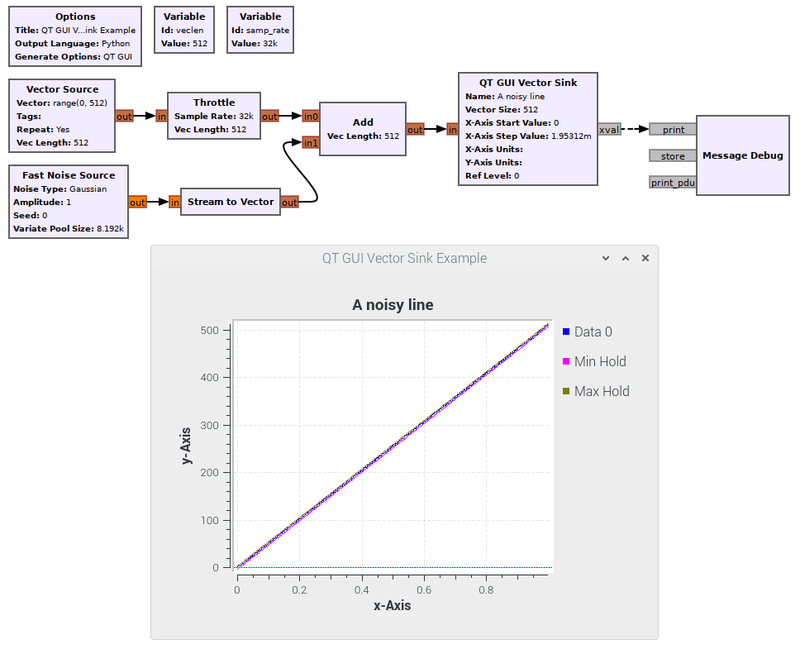
Example Flowgraph
This flowgraph and output was produced by https://github.com/gnuradio/gnuradio/blob/master/gr-qtgui/examples/qtgui_vector_sink_example.grc
Source Files
- C++ files
- [1]
- Header files
- [2]
- Public header files
- [3]
- Block definition
- [4]
