QT GUI Time Raster Sink
Jump to navigation
Jump to search
This is a QT-based graphical sink that takes in byte streams or floating point streams and plots a time_raster (spectrogram) plot.
Input stream: This expects a bit stream (0, 1 in the LSB of a byte). It will display packed bytes but the display will have to be autoscaled.
This sink can plot messages that contain either uniform vectors of float 32 values (pmt::is_f32vector) or PDUs where the data is a uniform vector of float 32 values.
Parameters
(R): Run-time adjustable
- Name
- Title for the plot
- Sample Rate
- Sample rate of signal
- Num. Rows (R)
- Number of rows to plot
- Num. Cols (R)
- Number of cols to plot
- Grid
- Int. min
- Int. max
- Multiplier (R)
- Vector of floats as a scaling multiplier for each input stream
- Offset (R)
- Vector of floats as an offset for each input stream
- Number of Inputs
- Number of streams connected
- Update Period (R)
- GUI Hint
- See GUI Hint for info about how to organize multiple QT GUIs
- Axis Labels
- Line Label
- Line Color
- Line Alpha
- X-Axis Label, X-Axis Start Value, X-Axis End Value, Y-Axis Label, Y-Axis Start Value, Y-Axis End Value (New as of 3.9)
- Allows the Time Raster to be able to look like a QT GUI Waterfall Sink if desired
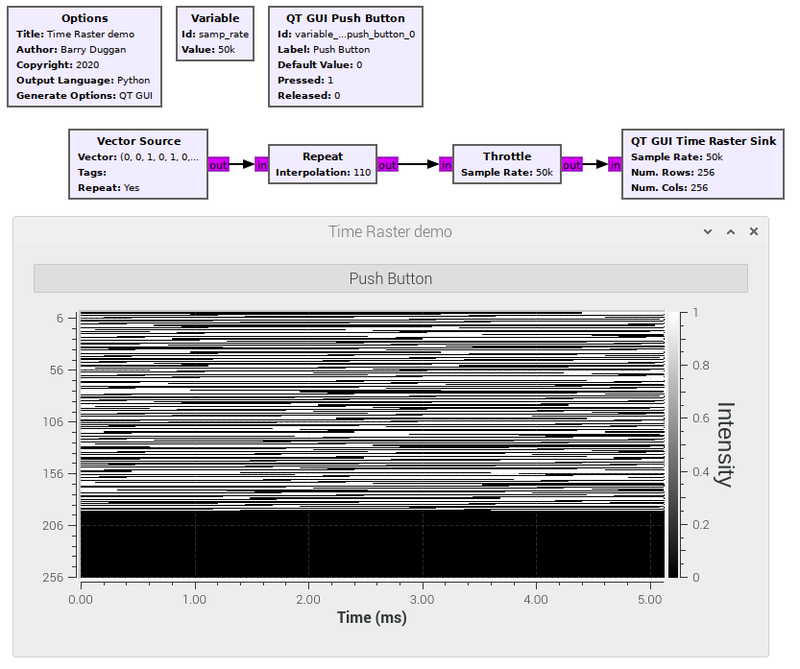
Example Flowgraph
This flowgraph and output show a QT GUI Time Raster Sink.
Source Files
- C++ files
- Float input
- Bit input
- Header files
- Float input
- Bit input
- Public header files
- Float input
- Bit input
- Block definition
- [1]
