QT GUI Frequency Sink: Difference between revisions
Jump to navigation
Jump to search
No edit summary |
|||
| Line 8: | Line 8: | ||
== Parameters == | == Parameters == | ||
; | ; Type | ||
: options: [Complex, Float, Complex Message, Float Message] | |||
; Name | |||
: title for the plot | |||
; FFT Size | |||
: size of the FFT to compute and display. If using the PDU message port to plot samples, the length of each PDU must be a multiple of the FFT size. | : size of the FFT to compute and display. If using the PDU message port to plot samples, the length of each PDU must be a multiple of the FFT size. | ||
; | ; Spectrum Width | ||
: | : options (if Float input): [Full, Half] | ||
; Center Frequency | ; Window Type | ||
: options: [Blackman-harris, Hamming, Hann, Blackman, Rectangular, Kaiser, Flat-top] | |||
: default: window.WIN_BLACKMAN_hARRIS | |||
; Normalize Window Power | |||
: options: [Yes, No] | |||
; Center Frequency (Hz) | |||
: center frequency of signal (only used for x-axis labels) | : center frequency of signal (only used for x-axis labels) | ||
; Bandwidth | ; Bandwidth (Hz) | ||
: bandwidth of signal (used to set x-axis labels) | : bandwidth of signal (used to set x-axis labels) | ||
: default: samp_rate | |||
; Grid | |||
: options: [Yes, No] | |||
; Autoscale | |||
: options: [Yes, No] | |||
; | ; Average | ||
: | : options: [None, Low, Medium, High] | ||
; Y min | |||
: default: -140 | |||
; Y max | |||
: default: 10 | |||
; Y label | |||
: default: "Relative Gain" | |||
; Y units | |||
: default: "dB" | |||
; Number of Inputs | |||
: default: 1 | |||
; Update Period | |||
: default: 0.10 | |||
; Show Msg Ports | |||
: options: [Yes, No] | |||
; GUI Hint | ; GUI Hint | ||
Revision as of 18:18, 9 April 2023
A graphical sink to display multiple signals in frequency.
This is a QT-based graphical sink that takes a set of floating point streams and plots the PSD. Each signal is plotted with a different color, and functions can be used to change the label and color for a given input number.
The sink supports plotting streaming float data or messages. The message port is named "in". The two modes cannot be used simultaneously, and should be set to 0 when using the message mode. GRC handles this issue by providing the "Float Message" type that removes the streaming port(s).
Parameters
- Type
- options: [Complex, Float, Complex Message, Float Message]
- Name
- title for the plot
- FFT Size
- size of the FFT to compute and display. If using the PDU message port to plot samples, the length of each PDU must be a multiple of the FFT size.
- Spectrum Width
- options (if Float input): [Full, Half]
- Window Type
- options: [Blackman-harris, Hamming, Hann, Blackman, Rectangular, Kaiser, Flat-top]
- default: window.WIN_BLACKMAN_hARRIS
- Normalize Window Power
- options: [Yes, No]
- Center Frequency (Hz)
- center frequency of signal (only used for x-axis labels)
- Bandwidth (Hz)
- bandwidth of signal (used to set x-axis labels)
- default: samp_rate
- Grid
- options: [Yes, No]
- Autoscale
- options: [Yes, No]
- Average
- options: [None, Low, Medium, High]
- Y min
- default: -140
- Y max
- default: 10
- Y label
- default: "Relative Gain"
- Y units
- default: "dB"
- Number of Inputs
- default: 1
- Update Period
- default: 0.10
- Show Msg Ports
- options: [Yes, No]
- GUI Hint
- See GUI Hint
Messages
Inputs
- 'freq'
- set the center frequency
- 'bw'
- set the bandwidth
Outputs
- 'freq'
- the frequency where the output plot was double-clicked
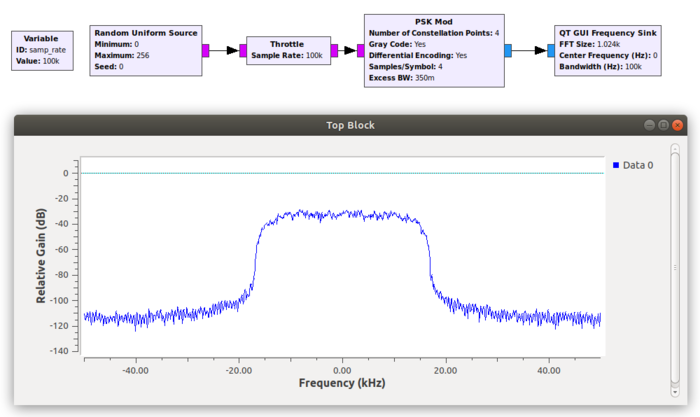
Example Flowgraph
Source Files
- C++ files
- TODO
- Header files
- TODO
- Public header files
- TODO
- Block definition
- TODO
