Uploads by Jesternofool
Jump to navigation
Jump to search
This special page shows all uploaded files.
| Date | Name | Thumbnail | Size | Description | Versions |
|---|---|---|---|---|---|
| 12:50, 11 May 2024 | ATSC04-Ch38.jpg (file) |  |
324 KB | ATSC 1.0 spectrum and spectrogram. The spectral line on the left edge of the signal is the pilot tone. | 1 |
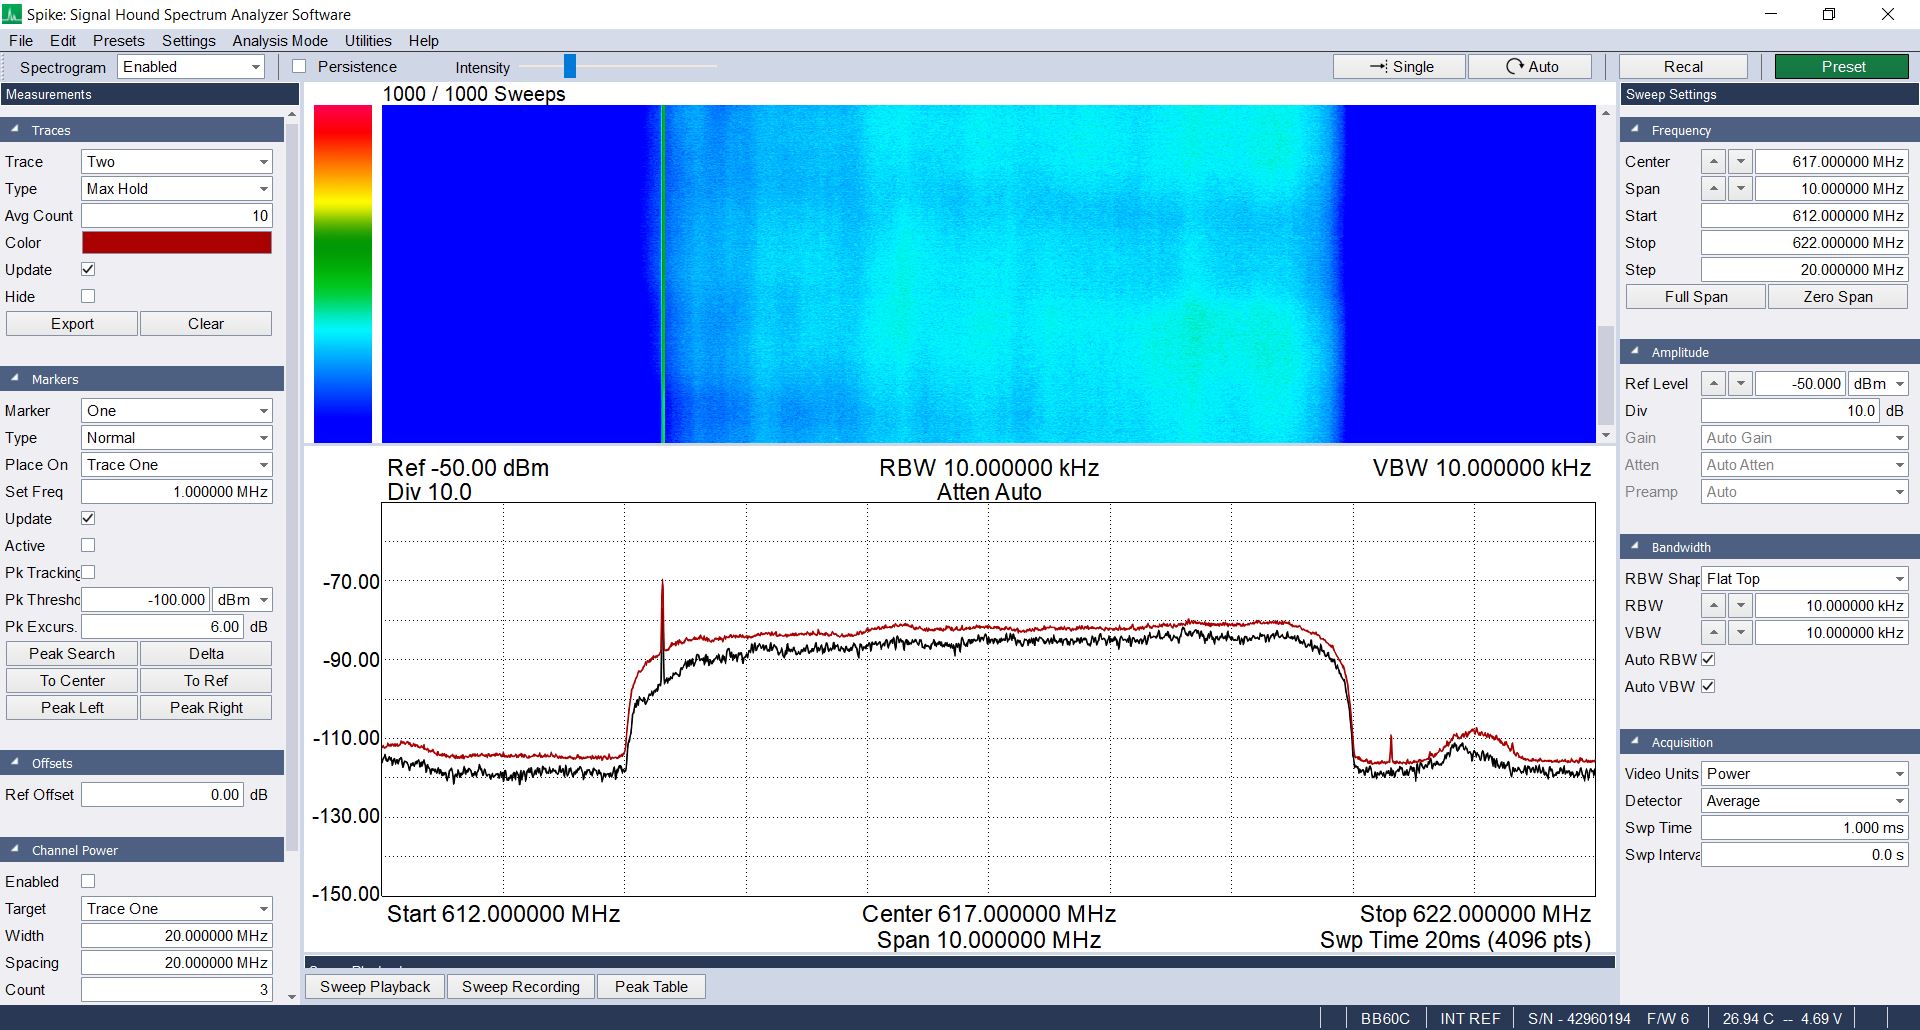
| 12:31, 11 May 2024 | ATSC-Ver3-Ch25-02.png (file) |  |
989 KB | Spectrum and spectrogram of ATSC 3.0 signal. The portion of the signal seen to the right of the 3.0 signal is a ATSC 1.0 transmission. The pilot tone for that transmission is the spectral line on the right. | 1 |
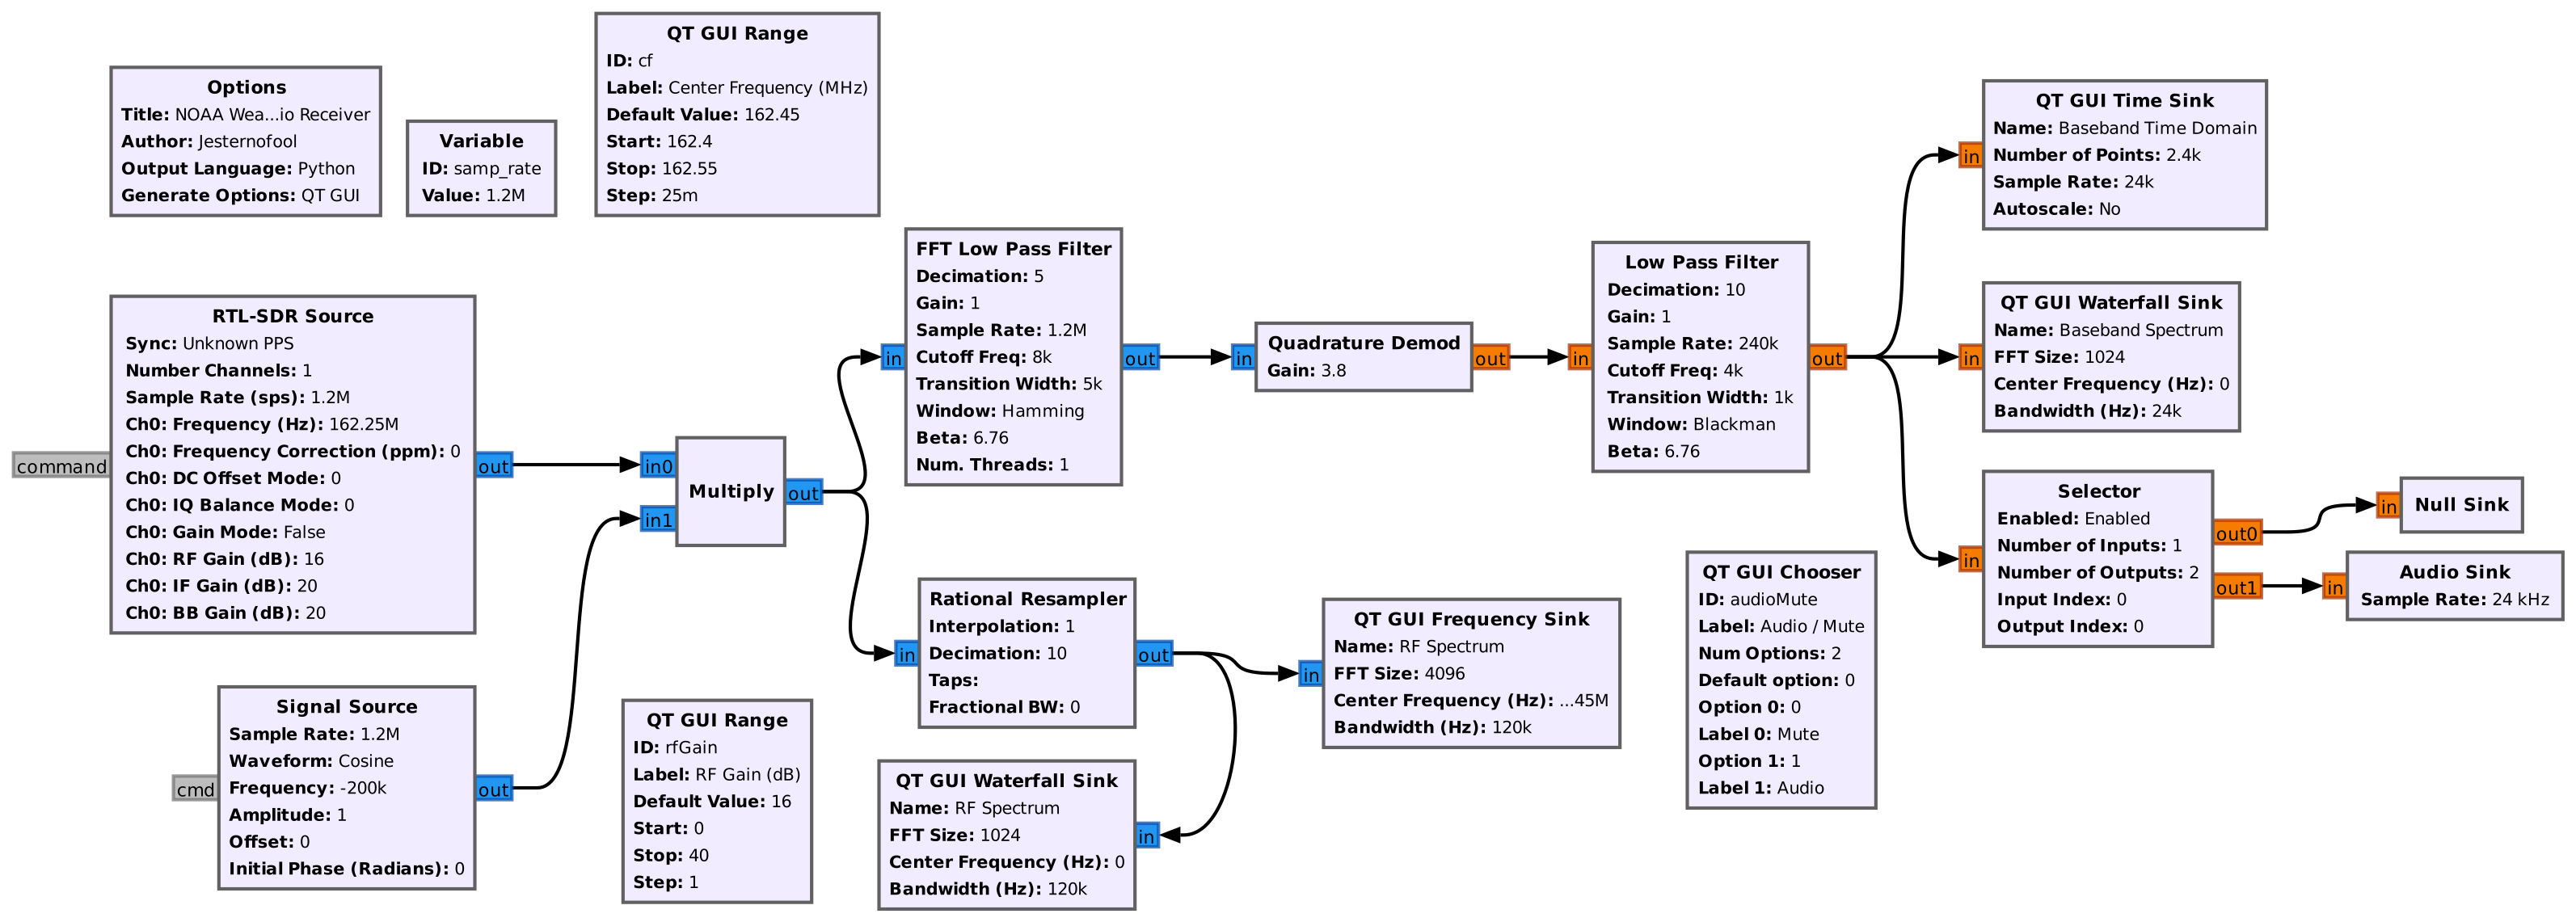
| 19:32, 13 April 2024 | NwrReceiver.jpg (file) |  |
327 KB | NOAA Weather Radio (NWR) receiver, to include both frequency and time domain displays. This flowgraph demonstrates the FFT Low Pass Filter block. | 1 |
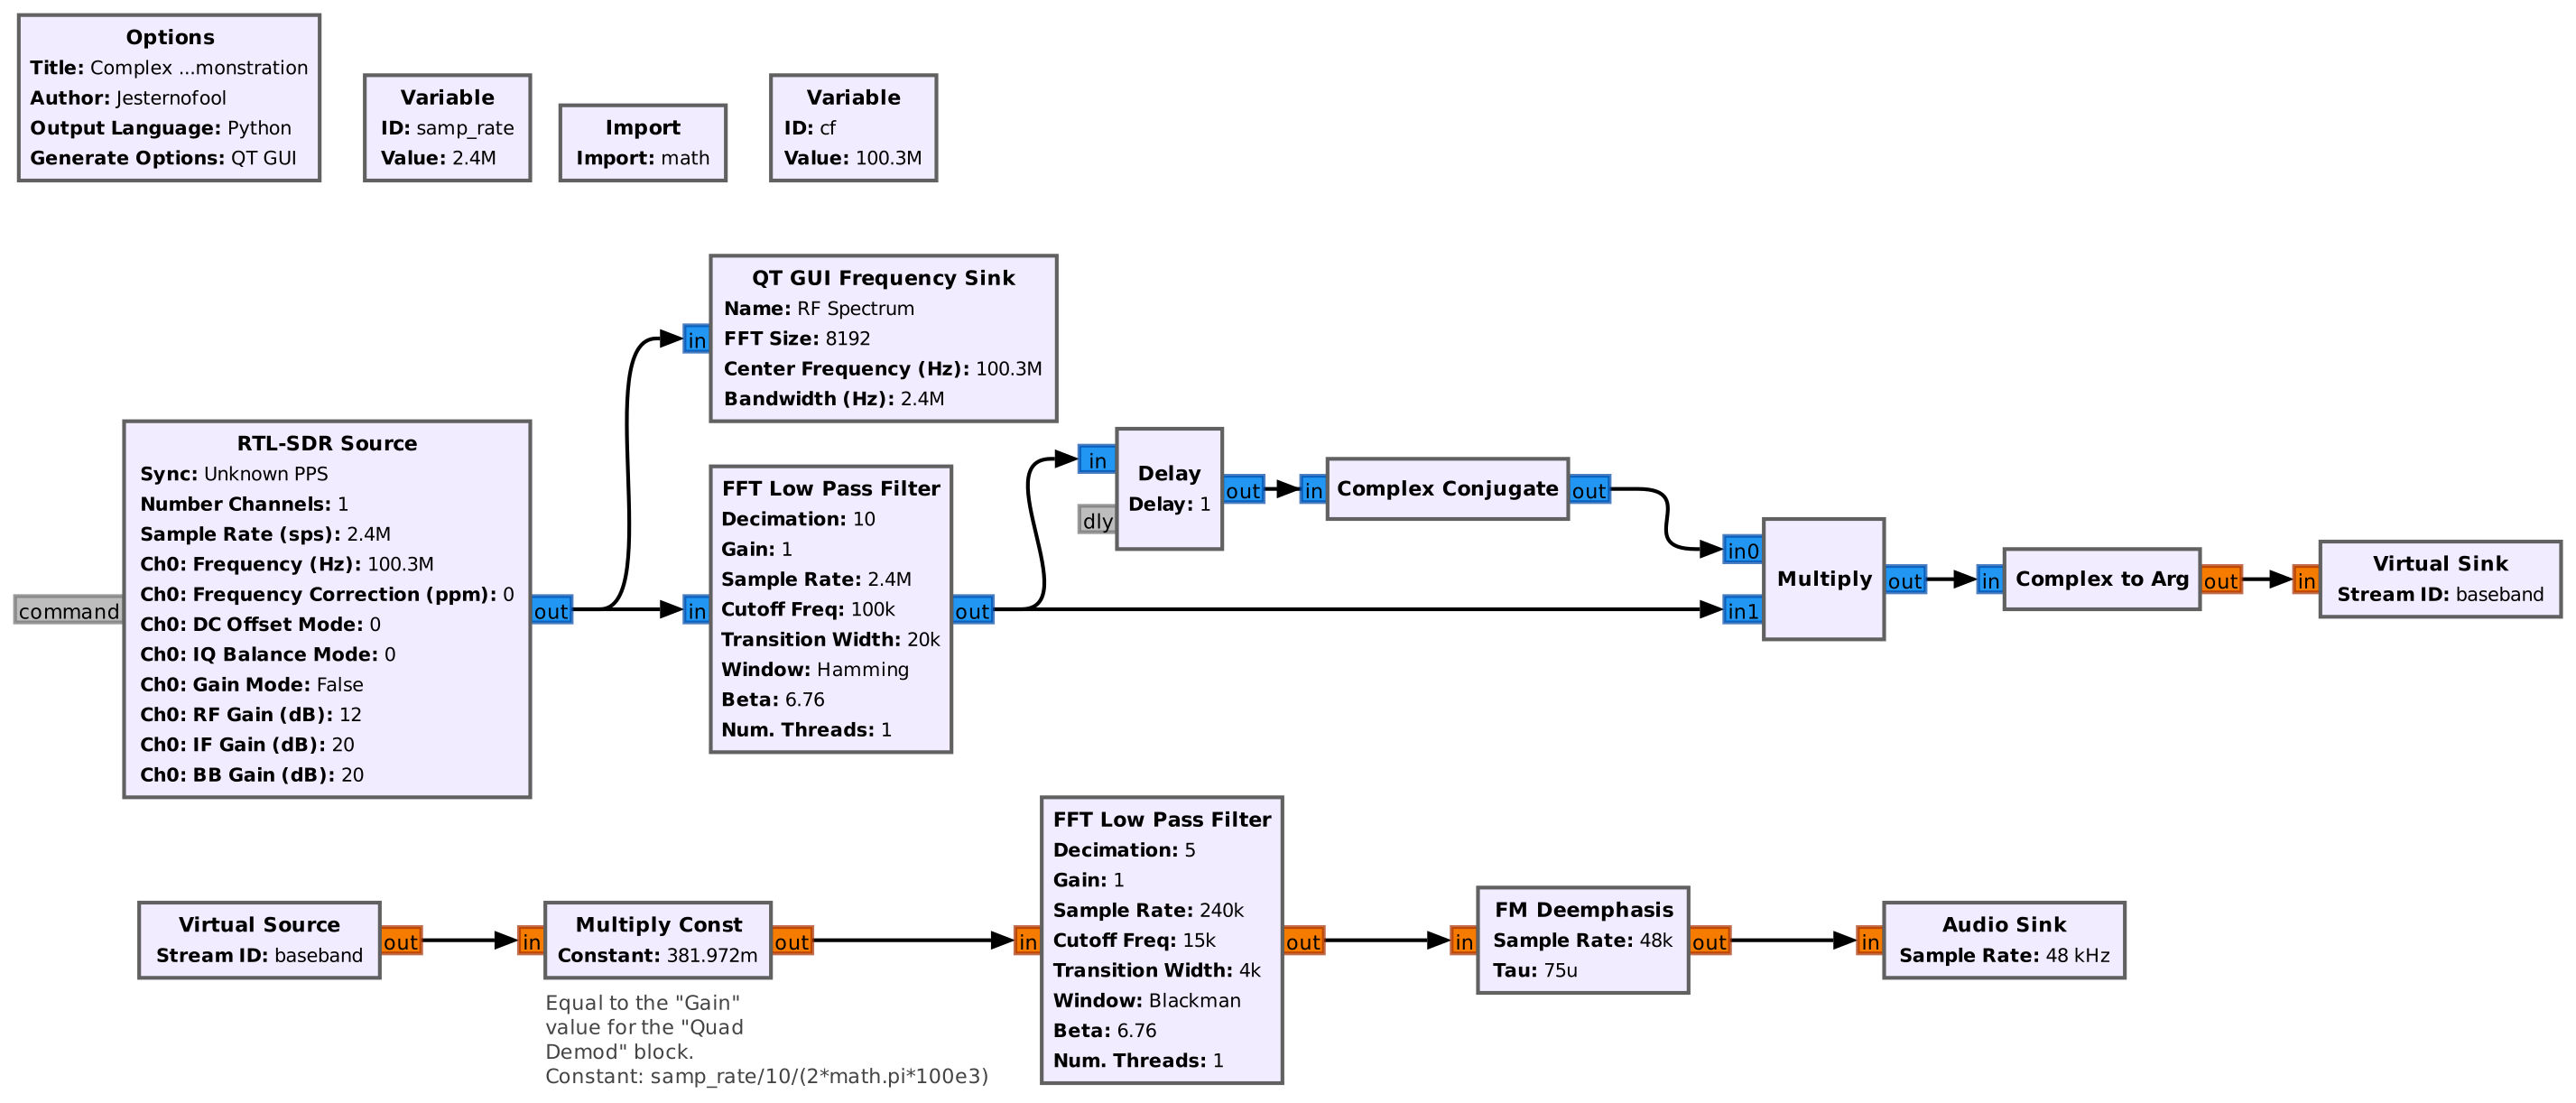
| 18:40, 13 April 2024 | Complex2ArgDemo.jpg (file) |  |
239 KB | This flowgraph demodulates a FM broadcast station. It demonstrates using the "Complex to Arg" block. The blocks from the output of the lowpass filter to the output of the "Multiply Const" block are equivalent to the "Quadrature Demod" block. | 1 |
| 17:22, 13 April 2024 | MeasureFmSignalPower.grc (file) | 17 KB | Flowgraph used to measure the signal-to-noise ratio (SNR) of a FM broadcast station. This flowgraph demonstrates a use of the Complex to Mag^2 block. | 1 | |
| 17:20, 13 April 2024 | ComplexMagSquaredSpectrum.grc (file) | 21 KB | Flowgraph used to create a basic spectral display. This is used to demonstrate how a spectral display is created using the FFT and Complex to Mag^2 blocks. | 1 | |
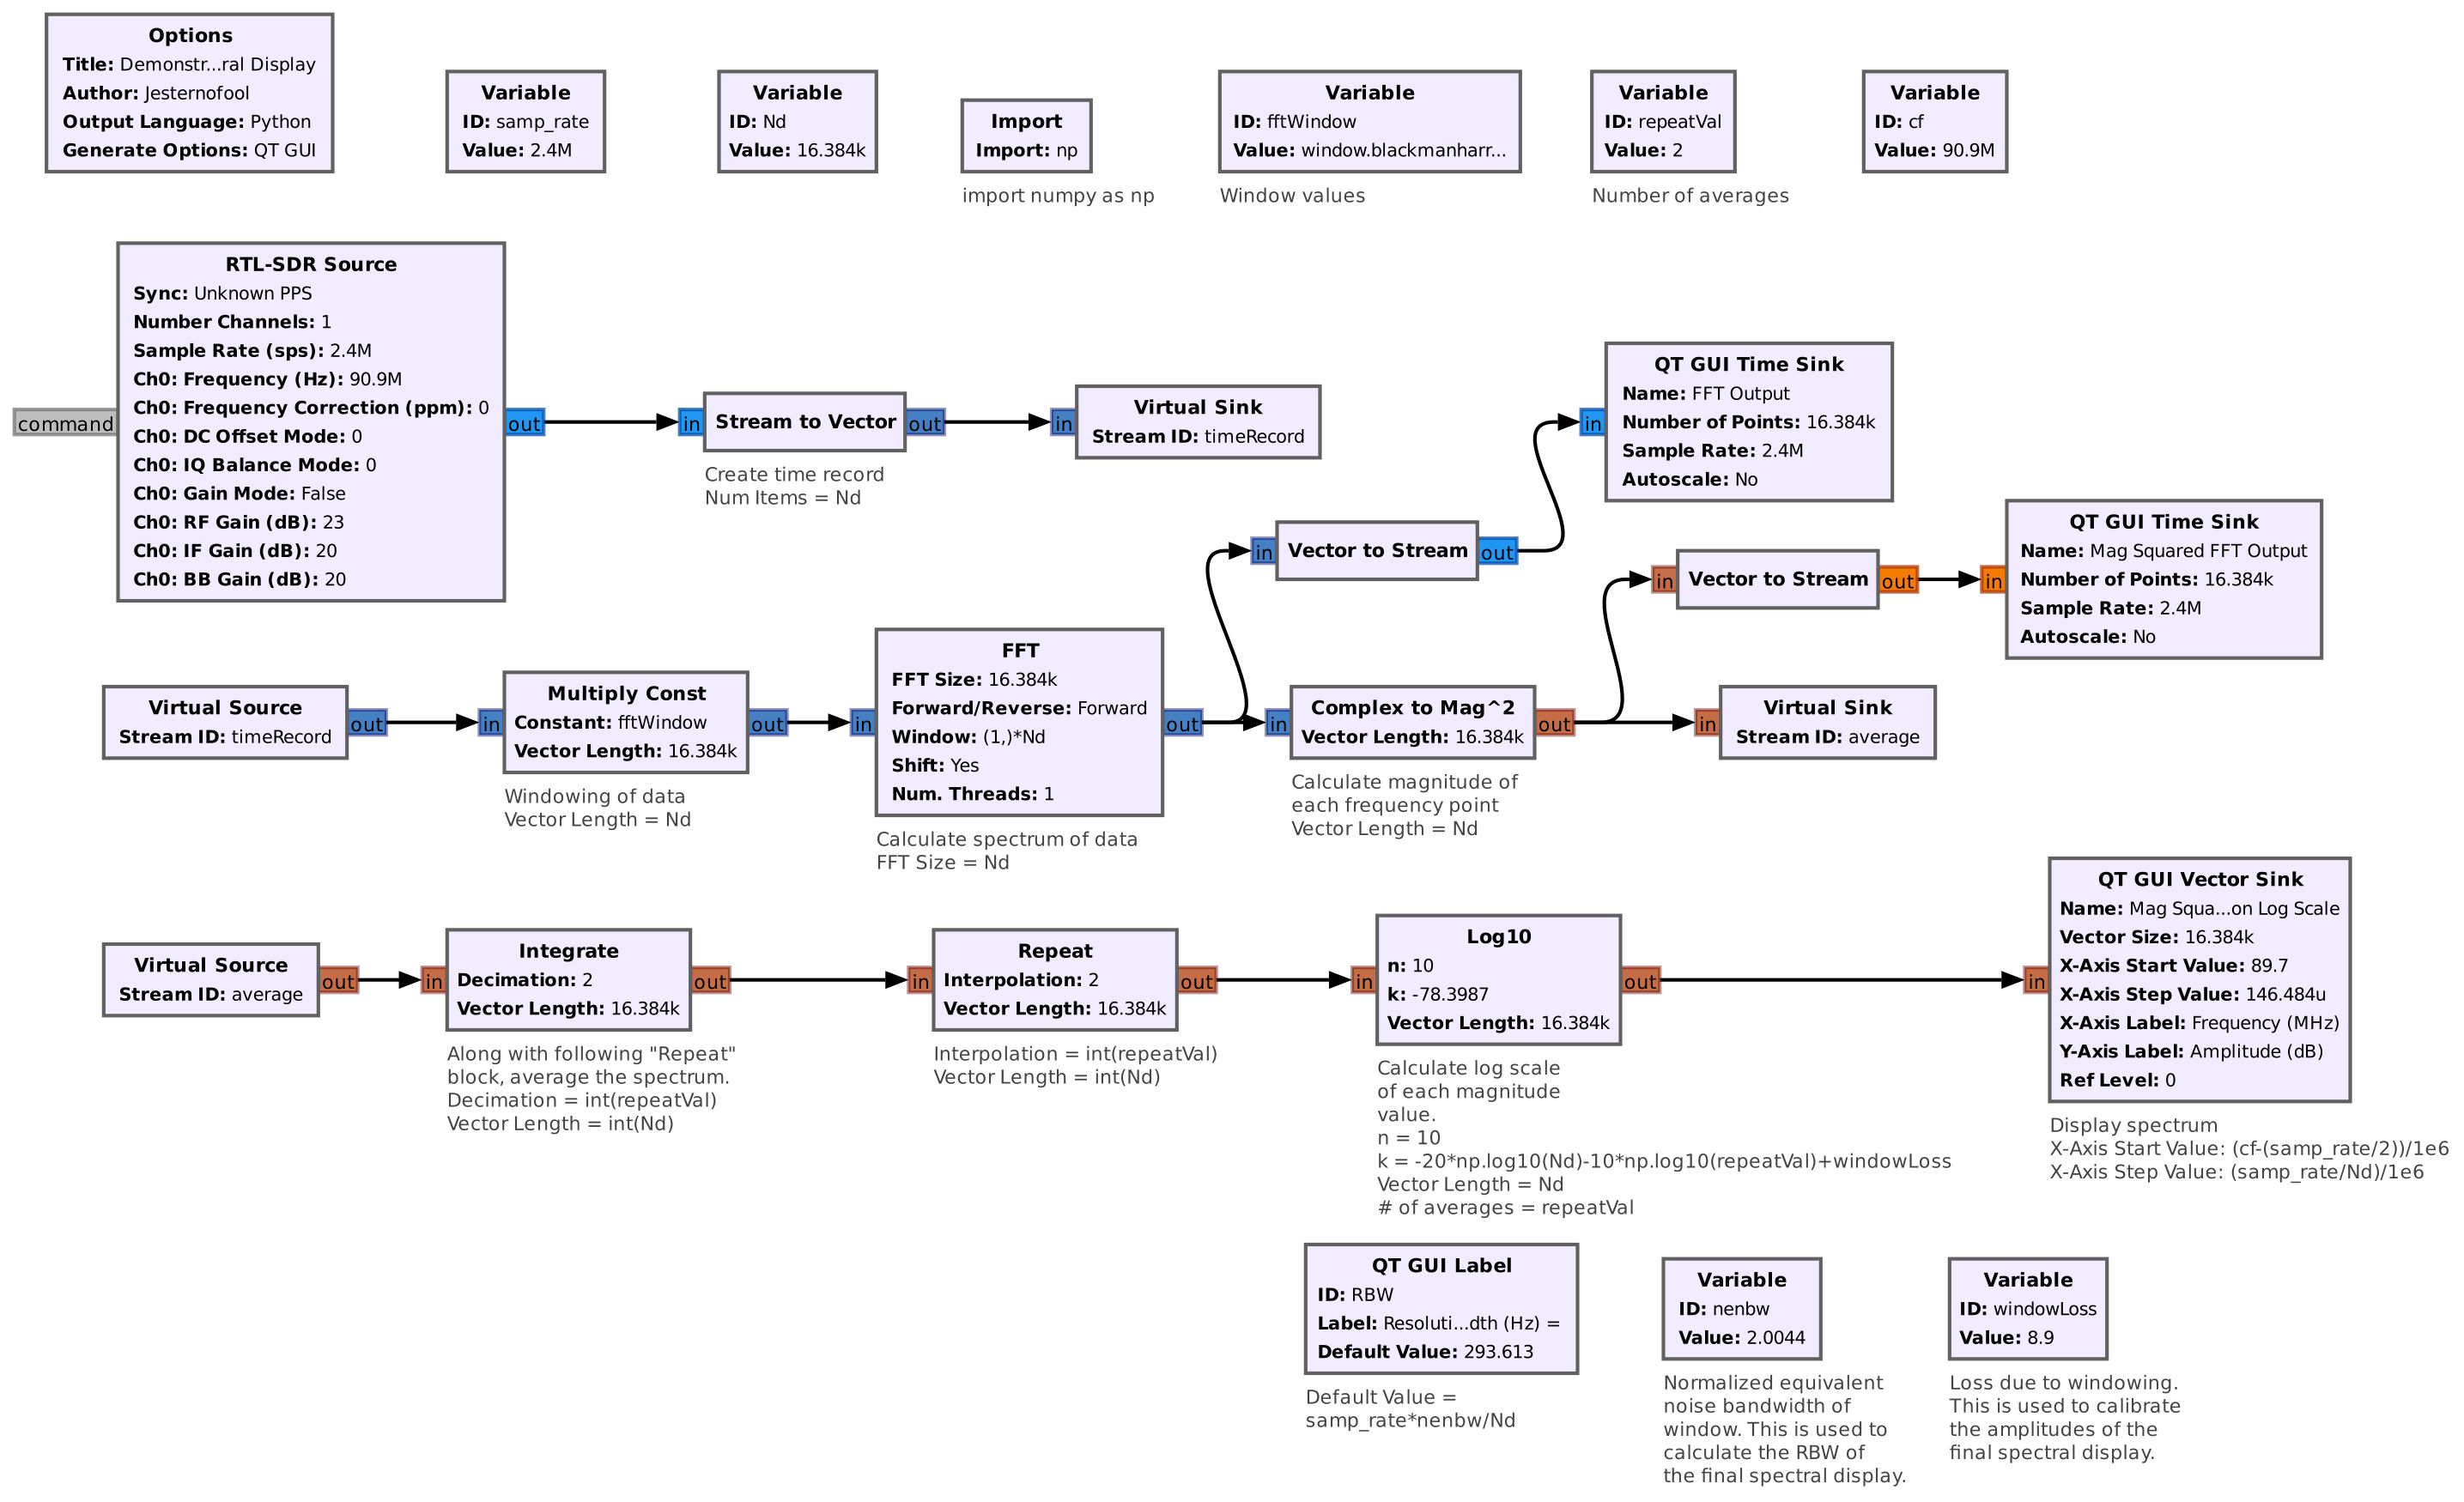
| 17:13, 13 April 2024 | ComplexMagSquaredSpectrum.jpg (file) |  |
412 KB | Flowgraph used to create a basic spectral display. This demonstrates several blocks, including the FFT and Complex to Mag Squared blocks. | 1 |
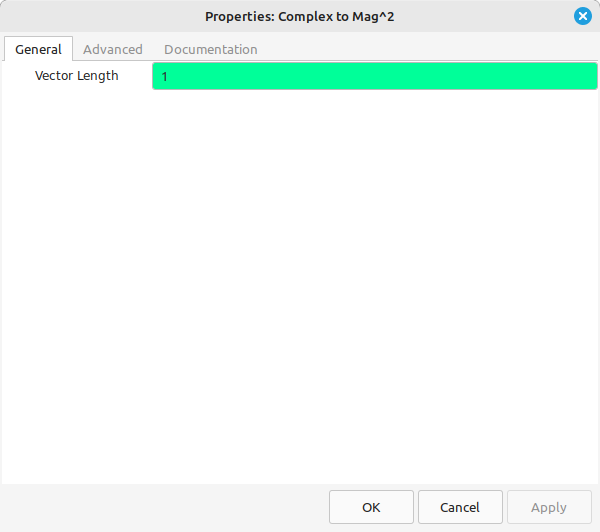
| 17:03, 13 April 2024 | Complex-to-Mag2-block-properties.png (file) |  |
14 KB | Property window for the Complex to Mag Squared block. | 1 |
| 17:00, 13 April 2024 | Complex-to-Mag2-block.png (file) |  |
5 KB | This is the GRC display of a Complex to Mag Squared block. | 1 |
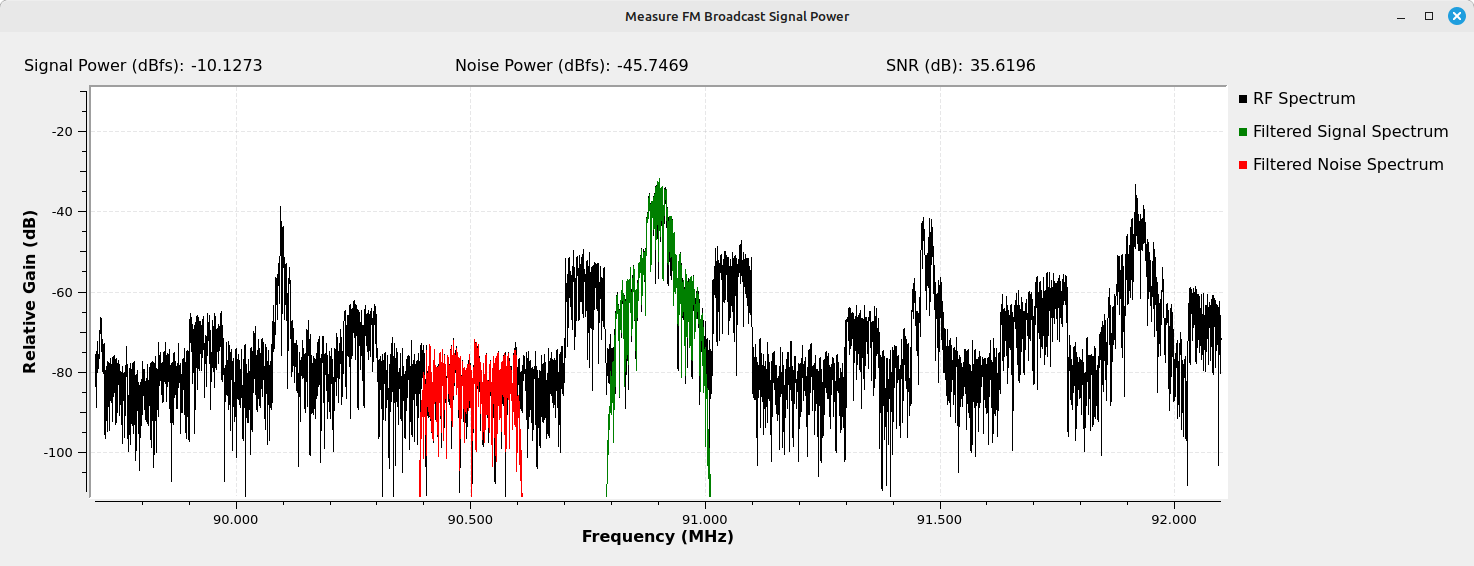
| 16:55, 13 April 2024 | Measure-signal-power-display.png (file) |  |
52 KB | Display from the flowgraph used to measure the signal-to-noise ratio (SNR) of a FM broadcast station. | 1 |
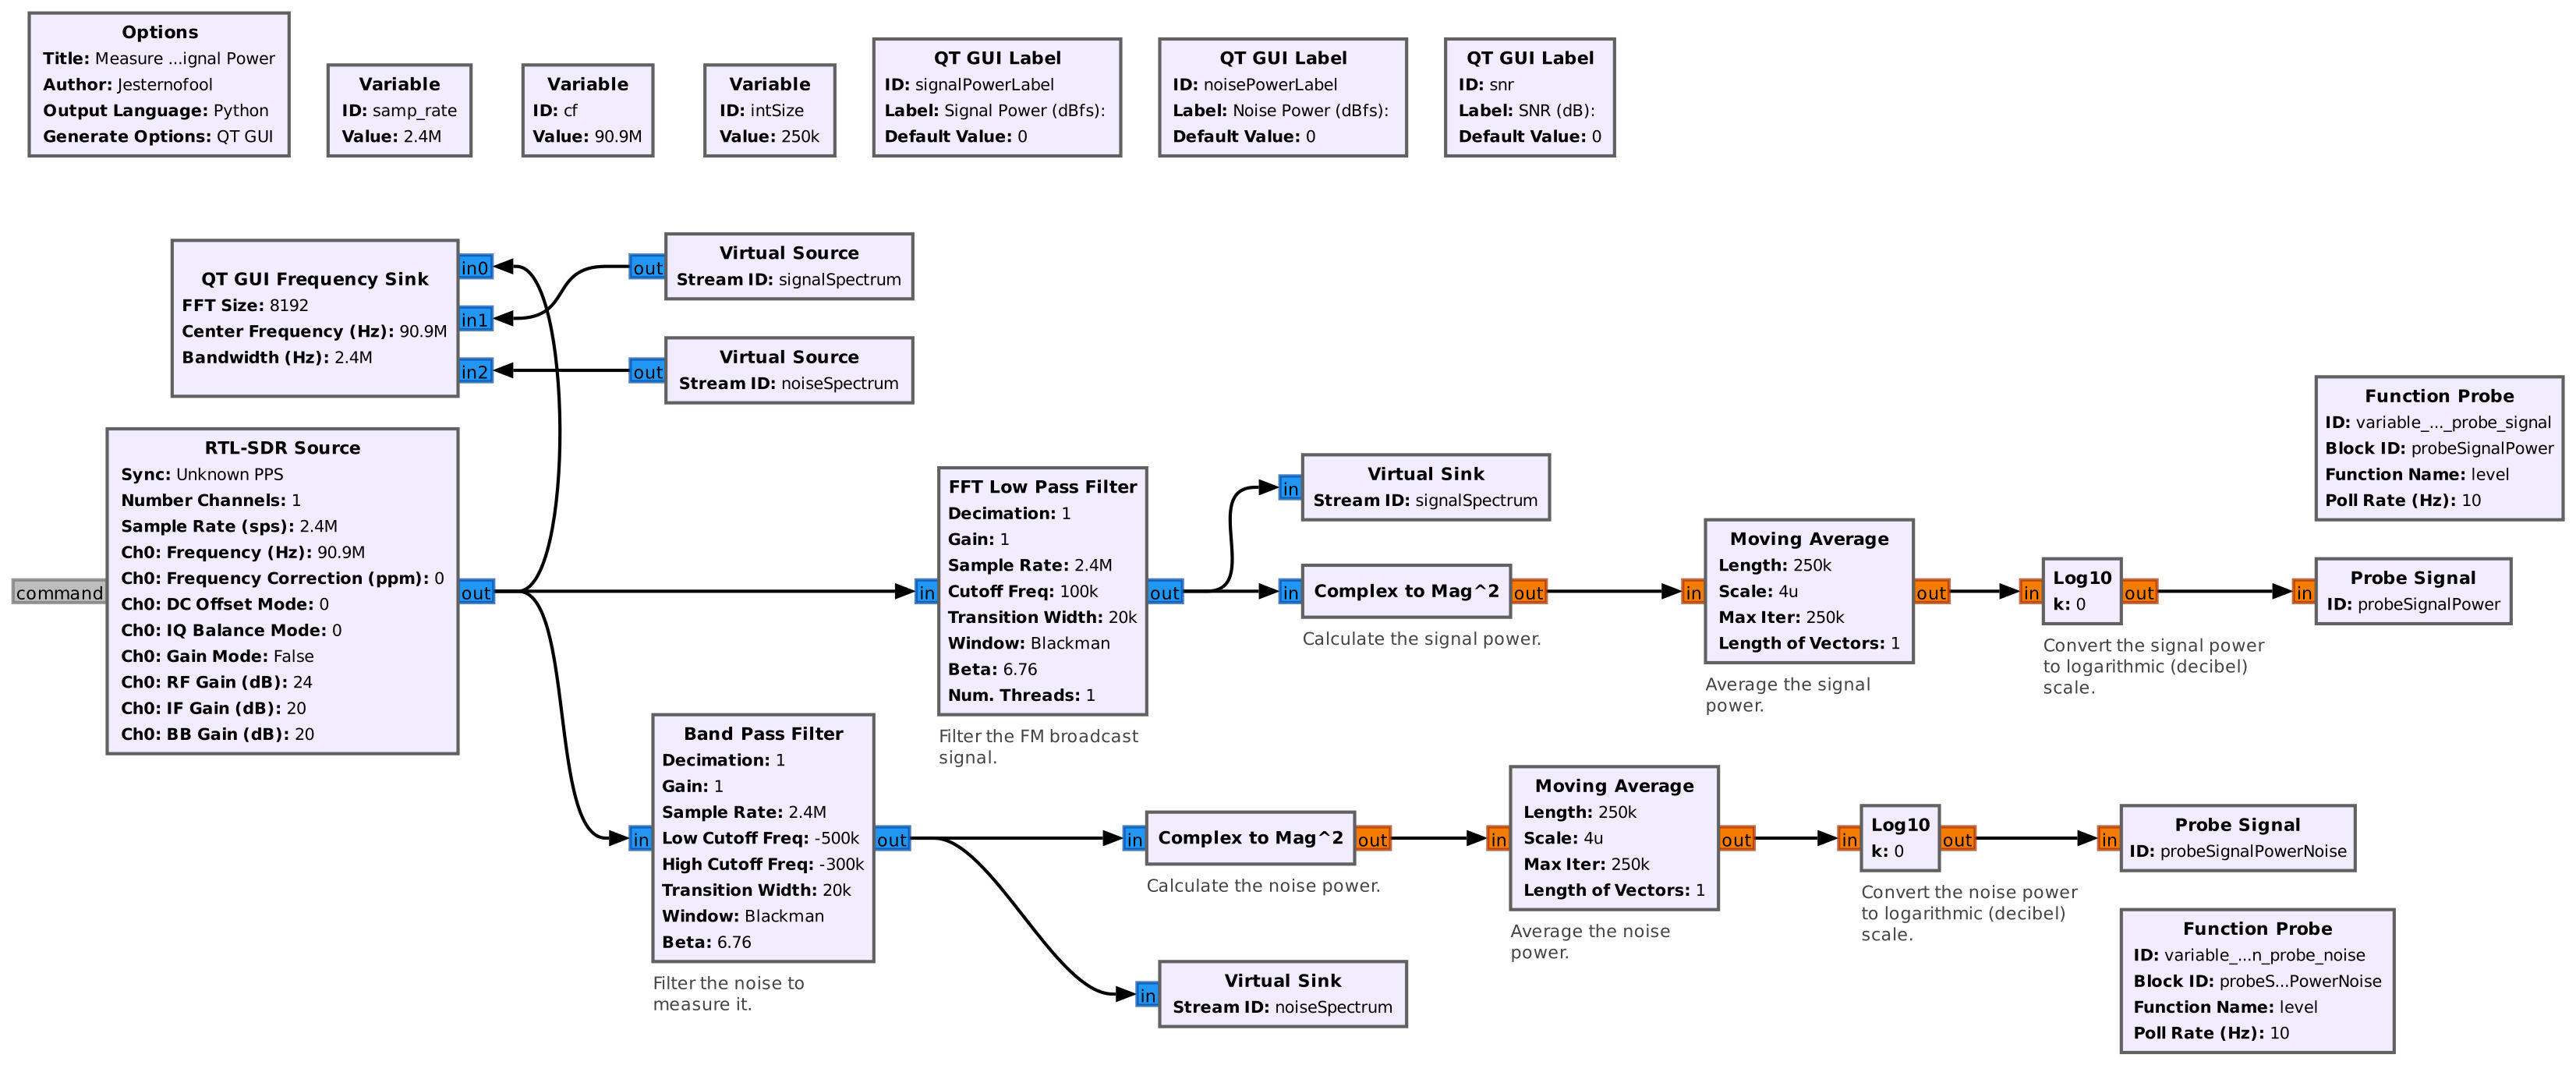
| 16:47, 13 April 2024 | MeasureFmSignalPower.jpg (file) |  |
365 KB | This is a flowgraph that will calculate the signal-to-noise ratio (SNR) of a FM broadcast station using a RTL-SDR. This flowgraph demonstrates both measuring signal power and use of the '''Complex to Mag^2''' block. | 1 |
| 01:45, 13 April 2024 | PhaseShiftDemo.grc (file) | 8 KB | This is the GRC file used to demonstrate the Phase Shift block. | 1 | |
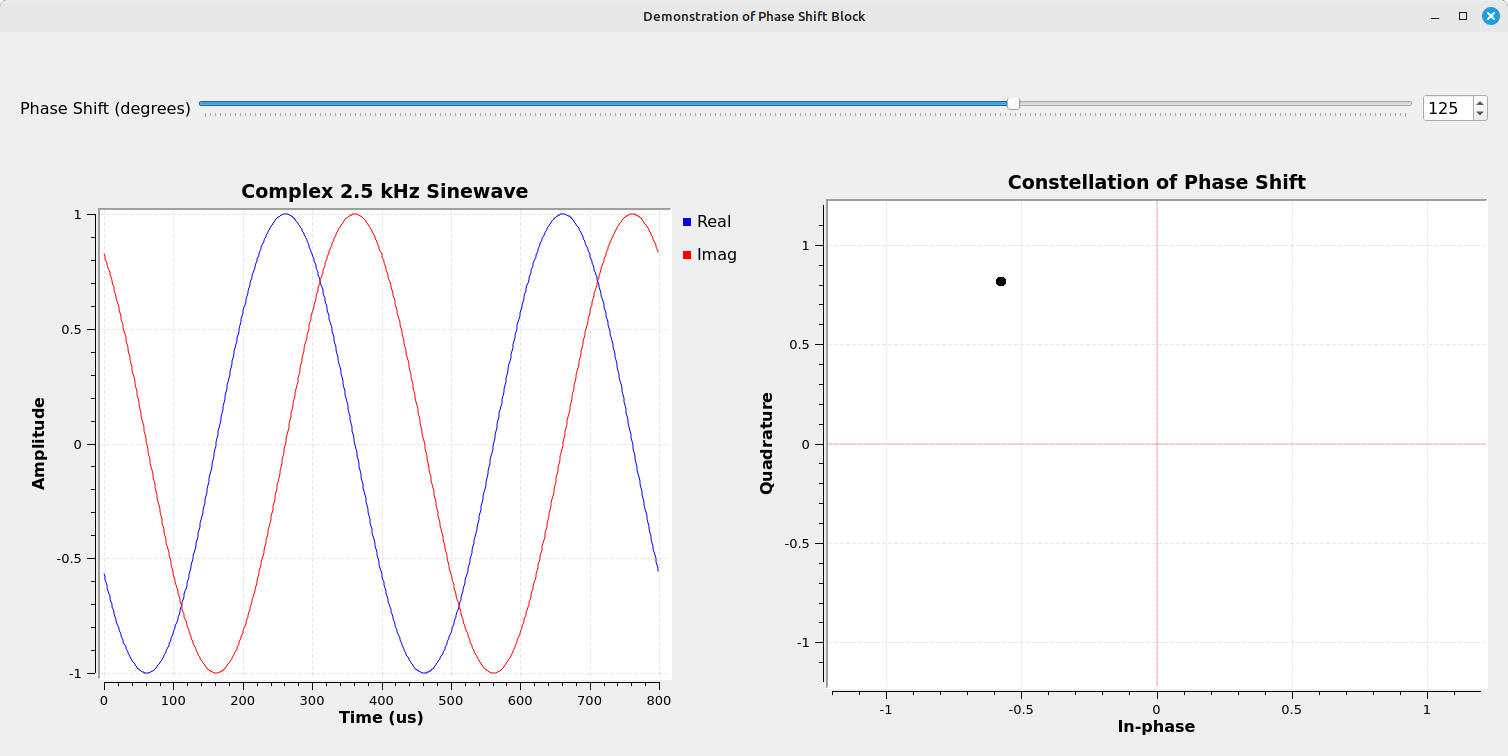
| 19:24, 12 April 2024 | Phase-shift-demo-display.png (file) |  |
62 KB | This is the time domain (left) and constellation (Argand) diagram showing the phase shift of a complex sinusoid. The phase has been shifted +125 degrees (3π/4 radians). | 1 |
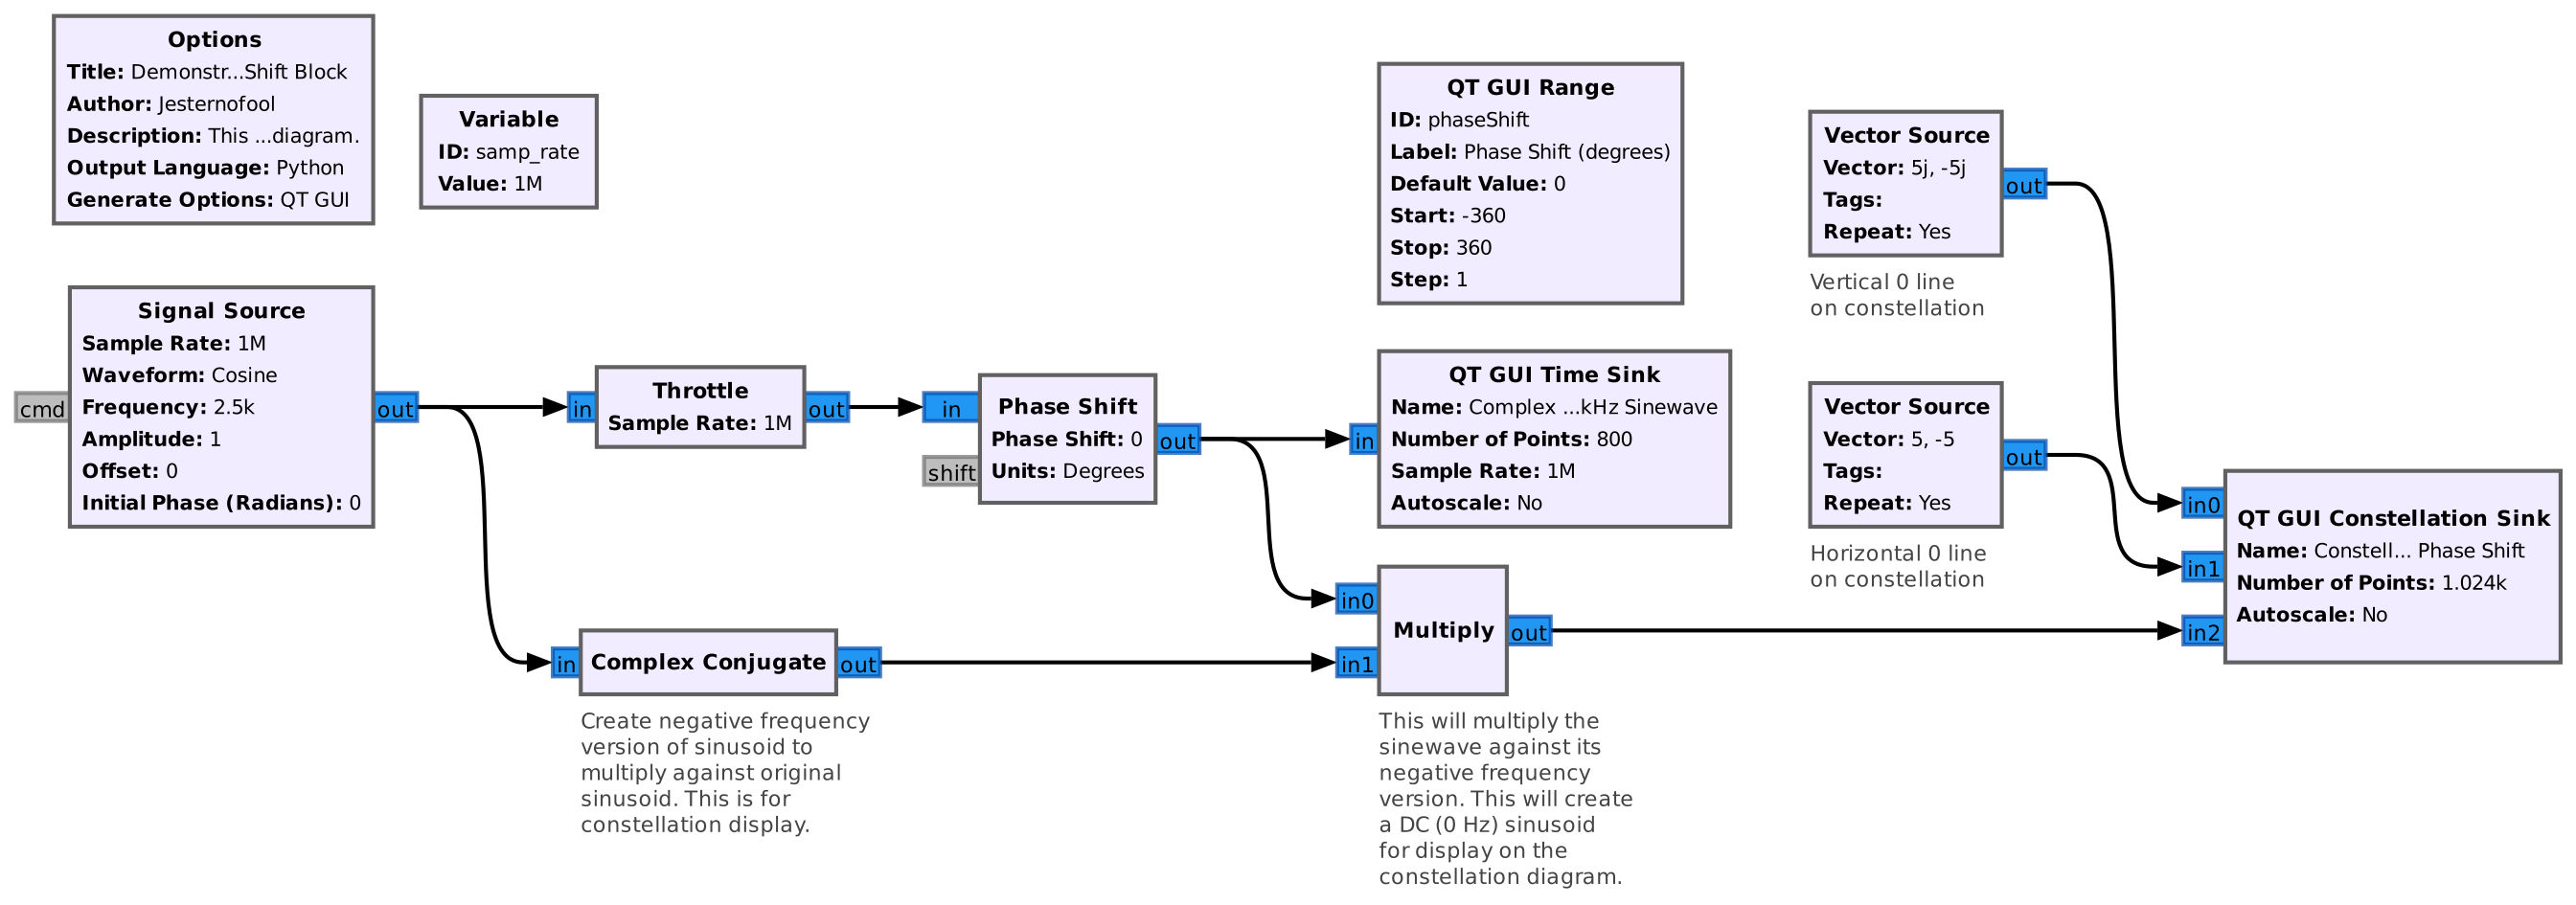
| 18:17, 12 April 2024 | PhaseShiftDemo.jpg (file) |  |
198 KB | Demonstration of the "Phase Shift" block using a time domain (time sink) and constellation diagram. | 1 |