Guided Tutorial GRC: Difference between revisions
| Line 35: | Line 35: | ||
<pre>$ gnuradio-companion</pre> | <pre>$ gnuradio-companion</pre> | ||
If | If you are unable to open GRC then you need to go back to [InstallingGR troubleshoot our installation] . | ||
=== Searching for Blocks === | === Searching for Blocks === | ||
Revision as of 02:33, 15 September 2018
<. Previous: Introduction >. Next: Programming GNU Radio in Python
Tutorial: GNU Radio Companion
Objectives
- Create flowgraphs using the standard block libraries
- Learn how to debug flowgraphs with the instrumentation blocks
- Understand how sampling and throttle works in GNU Radio
- Learn how to use the documentation to figure out block's functionality
Prerequisites
- Basic knowledge of git
- GNU Radio 3.7.4 or later
- Tutorial 1: Intro to GNU Radio
Setting up the Tutorials
Before we can begin, we need to mention that the solutions (including the images, grc files, and module files) are available on gr-tutorial github if you wish to have them. We will be referencing the files but will for the most part be making our own files so that we can get practice and build intuition. Thus, we recommend not downloading and installing them until you finish these tutorials or are stuck on a step. For instructions on installing these solutions, see Installing the Tutorials Modules.
Getting to Know the GRC
We have seen in Tutorial 1 that GNU Radio is a collection of tools that can be used to develop radio systems in software as opposed to completely in hardware. In this tutorial, we start off simple and explore how to use the GNU Radio Companion (GRC), GNU Radio's graphical tool, to create different tones. We should keep in the back of our mind that GRC was created to simplify the use of GNU Radio by allowing us to create python files graphically as opposed to creating them in code alone (we will discuss this more later).
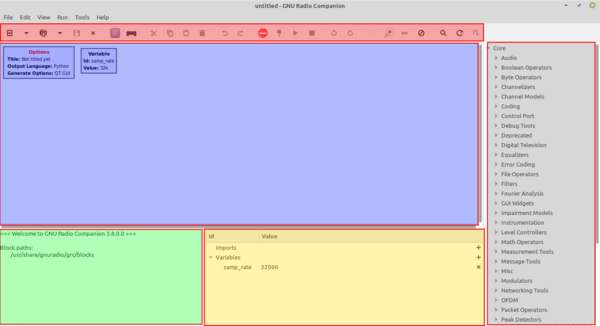
The first thing to cover is the interface. There are four parts: Library, Toolbar, Terminal, and Workspace.
The tutorial is meant to be hands on, so please take a few breaks from reading here and there to experiment. We will reiterate that these tutorials as simply meant as guides and that the best way to learn something is to try it out: come up with a question, think of a possible solution, and try it out. Let us begin by starting up the GRC! This is usually done by opening up a terminal window (ctrl+alt+t in Ubuntu) and typing:
$ gnuradio-companion
If you are unable to open GRC then you need to go back to [InstallingGR troubleshoot our installation] .
Searching for Blocks
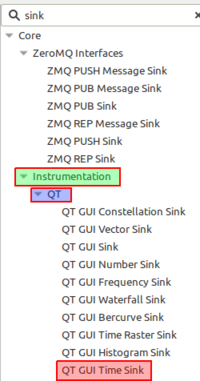
The Library contains the different blocks installed in the GRC block paths. Here we find blocks that are preinstalled in GNU Radio and blocks that are installed on the system. At first it seems daunting to look for blocks. For instance, if we want to generate a waveform, what category should we look in? We see there is a Waveform Generators category, okay not bad. But what if we wanted to find some way to display our data but aren't sure of the best way to display it yet? We know from tutorial 1 that this is known as a sink; however, looking through the list there is no Sinks category. The solution is to use the Search feature by either clicking the magnifying glass icon or typing Ctrl+f and then start typing a keyword to identify the block. We see a white box appear at the top of the Library with a cursor. If we type "sink", we can find all the blocks that contain the words "sink" and the categories we will find each block in.
For now, let's add the block called QT GUI Time Sink by clicking on its name and dragging it to the Workspace or double-clicking on its name for it to be placed automatically in the Workspace.
Modifying Block Properties
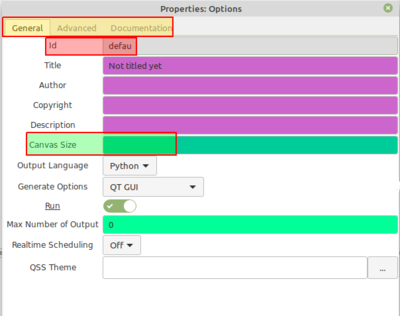
The workspace contains the flowgraph and all the different options for various block parameters. Let us double-click on the Options Block to examine its properties. We see a window as below:
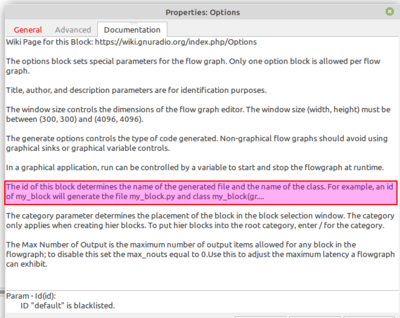
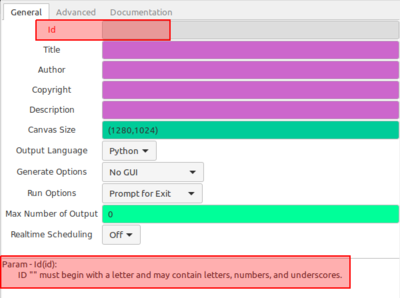
These block properties can be changed from the defaults to accomplish different tasks. Let's remove part of the current name and notice the ID turns blue. This color means that the information has been edited, but has not been saved. Let us change the parameter Window Size to "300,300" and click OK. Yikes! Almost all the workspace got cutoff! Let's do a ctrl+z to go back to our default size. If we go back to the Options Block properties, we can see that there are different tabs and one is titled documentation.
If we read a couple lines, we can see that the property ID is actually used for the name of the python file the flowgraph generates.
So now let's remove the entire ID string. Notice now that at the bottom appears an error message. Also notice that the parameter ID is now red to show us exactly where the error occured.
To keep things organized, let us change the ID to "tutorial_two_1". Let us also make sure that the property Generate Options is set to "QT GUI" since we are using a QT GUI sink and not a WX GUI sink. Newer versions of GNU Radio default to using QT GUI. The ID field allows us to more easily manage our file space. While we save the GRC flowgraph as a <filename>.grc, generating and executing this flowgraph produces another output. GRC is a graphical interface that sits on top of the normal GNU Radio programming environment that is in Python. GRC translates the flowgraph we create in the GUI canvas here into a Python script, so when we execute a flowgraph, we are really running a Python program. The ID is used to name that Python file, saved into the same directory as the .grc file. By default, the ID is top_block and so it creates a file called top_block.py. Changing the ID allows us to change the saved file name for better file management.
Another result of this GRC-Python connection is that GRC is actually all Python. In fact, all entry boxes in block properties or variables that we use are interpreted as Python. That means that we can set properties using Python calls, such as calling a numpy or other GNU Radio functions. A common use of this is to call into the filter.firdes filter design tool from GNU Radio to build our filter taps.
Another key to notice is the different colors present in the fields we can enter information. These actually correspond to different data types which we will cover later in this tutorial.
My First Flowgraph
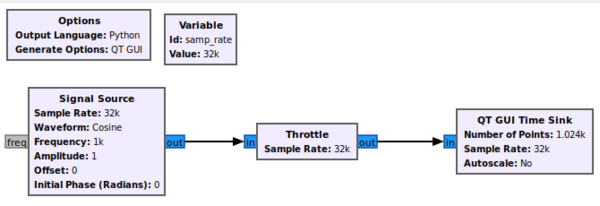
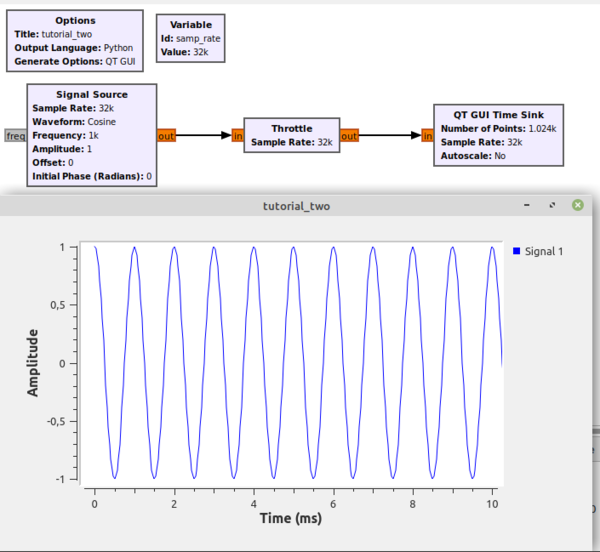
Now that we have a better understanding of how to find blocks, how to add them to the workspace, and how to edit the block properties, let's proceed to construct the following flowgraph of a Signal Source being sent to a Throttle Block and then to our Time Sink by clicking on the data type colored ports/tabs one after the other to make connections:
With a usable flowgraph we can now proceed to discuss the Toolbar.
A note on the throttle block: What exactly this does is explained in greater detail later on in this tutorial. For now, it will suffice to know that this block throttles the flow graph to make sure it doesn't consume 100% of your CPU cycles and make your computer unresponsive.
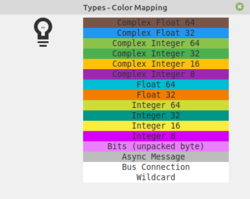
This section of the interface contains commands present in most software such as new, open, save, copy, paste. Let's begin by saving our work so far and titling our flow graph tutorial_two. Important tools here are Generate flowgraph, Execute flowgraph, and Kill flowgraph all accessible through F5, F6, and F7 respectively. A good reference is available in Help->Types that shows the color mapping of types which we will look into later.
A Note on Generate Options
Let us click the Generate button and turn our eyes to the Terminal at the bottom of the window. We should see it generated a Python file with the same name as the ID from our Options Block. The terminal displays important messages such as errors and warnings. Two common errors are when we mismatch the generate options with the graphical tools we are using. For instance, if we were to use the WX GUI as our generate options but have a QT GUI graphic then we would get in the terminal:
And if we were to use the QT GUI generate options with a WX GUI graphic we would get in the terminal:
It should be noted that we are doing away with WX GUI in future releases so only use QT GUI.
Examining the Output
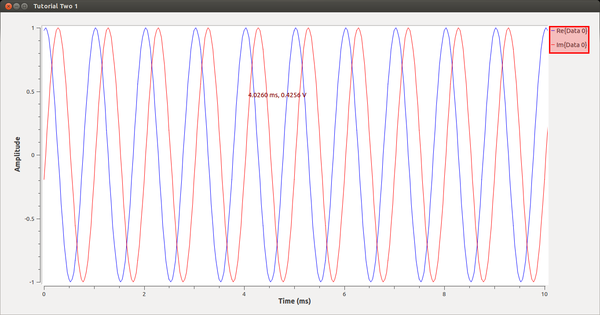
Let's go ahead and Execute the flowgraph to see our sine wave.
We should get the above which is a complex sinusoid of the form e jwt. Let us keep things simple by avoiding complex signals for now. First we want to kill the flowgraph with the Kill flowgraph button or by simply closing the Time Sink GUI. Now is a good time to go over data types in GNU Radio by opening up the Help->Types window.
We can see common data types seen in many programming languages. We can see our blocks (blue ports) are currently Complex Float 32 type which means they contain both a real and imaginary part each being a Float 32 type. We can reason that when the Time Sink takes in a complex data type, it outputs both the real and imaginary part on separate channels. So let's now change the Signal Source to a float by going into its block properties and changing the Output Type parameter. We see that its port turns orange, there is now a red arrow pointing to the Throttle Block, and in the Toolbar there is a red "-" button (red) that reads "View flow graph errors". Let's go ahead and click that.
We see that in the specified connection, there is size mismatch. This is due to our data type size mismatch. GNU Radio will not allow us to chain together blocks of different data sizes, so let's change the data type of all of our subsequent blocks. We can now generate and execute as before.
We now see our sine wave on one channel. We can click on the screen and move the mouse to zoom and rescale.
Using the Companion
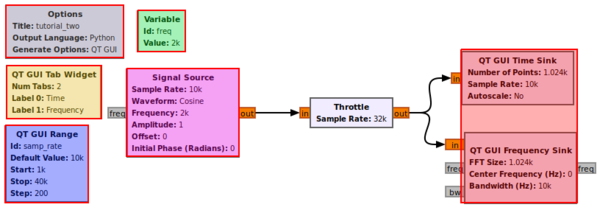
Now that we are able to create flowgraphs on our own, we should explore some of the useful features in GNU Radio. Let's begin with the flowgraph below:
Time & Frequency Flowgraph
Detailed Changes:
- We are starting a new flowgraph with ID "tutorial_two_3"
- In QT GUI Tab Widget, ID to "tab", Num Tabs to 2, Label 0 to "Time", Label 1 to "Frequency"
- In QT GUI Range, ID to "samp_rate", Default Value to "5*freq", Start to "0.5*freq", Stop to "20*freq", Step to "200"
- In Variable, ID to "freq", Value to "2e3"
- In Signal Source, Frequency to "freq", Waveform to "Sine"
- In QT GUI Time Sink, GUI Hint to "tab@0". In QT GUI Frequency Sink, GUI Hint to "tab@1"
- In Throttle, Sample Rate to 32e3 (more on why later)
Once we have verified our changes, let's Generate, and Execute. We should produce the figure below:
Sampling rate is an interesting subject in GNU Radio -- and, indeed, any software radio platform. Please see the Extras on Sampling Rate page that explores how changing the sample rates in the above flowgraph affects the signals.
How to Use INSERT_BLOCK_NAME_HERE
There are many ways to display multiple graphs. For instance, if we have a big screen, we could use the [GNURadioCompanion#Example Grid Position notation] present in the GUI Hint property or we can make our sinks have multiple inputs. There are multiple ways to change variables such as the Chooser. There are different ways to display signals such as the Waterfall Sink. Now that we have the basics, we can approach any block, look at its documentation, and figure out how to use it.
Examining the Probe Signal Block
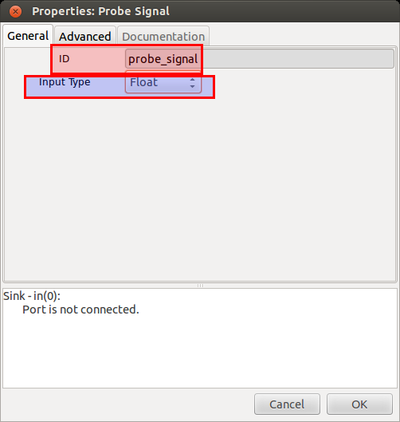
For instance, let's go over a question that was asked on the mailing list on how to use the Probe Signal block. We can see its properties below:
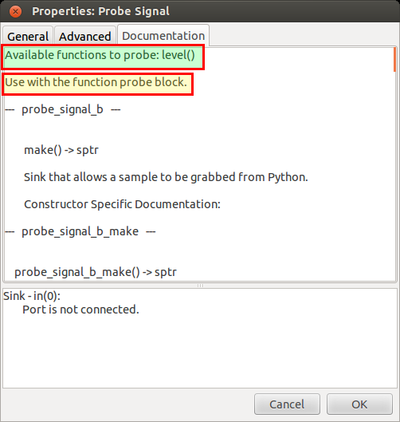
And its documentation:
First, let's give this guy an ID, let's do "probe_signal" and change the Input Type to "Float". If we look at the documentation, we can see that the functions of the block are "level" and that it needs to be used with the Function Probe block. So let's put down a Function Probe block and examine its properties.
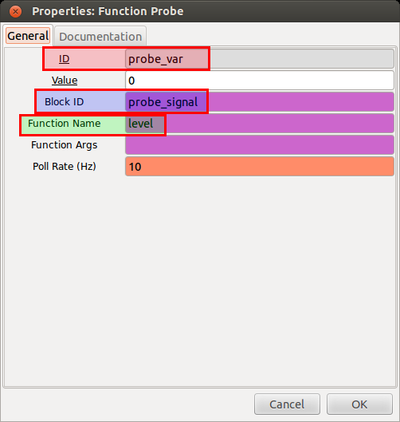
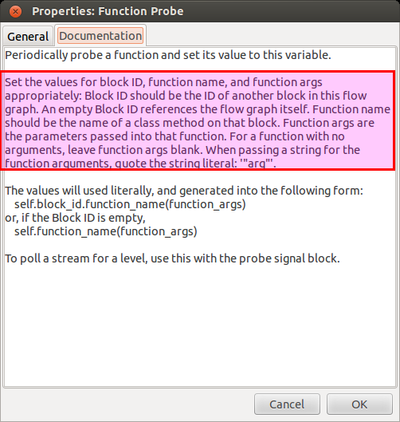
And its documentation:
First, we should give it an ID, let's do "probe_var". If we look at the documentation, it tells us that Block ID should be ID of another block in the flowgraph. In this case, the ID of our Probe Signal block which is "probe_signal". It also says, Function Name should be the name of a class method on the Probe Signal block. We know the documentation of the Probe Signal block told us its function was "level" so let's put that there. The Function Args are the parameters passed into the function. Recalling the previous documentation, the function was "level();" therefore, no arguments are passed to it.
Displaying Text Based Information
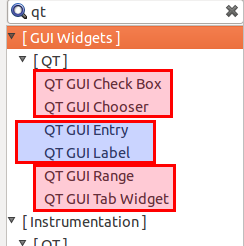
If we run the flowgraph, we notice that nothing happens, so we need a way to display the data. We can't really use a sink in this case because the Probe Signal block is already a sink. Instead, let's look at the available options for display blocks when we search "qt".
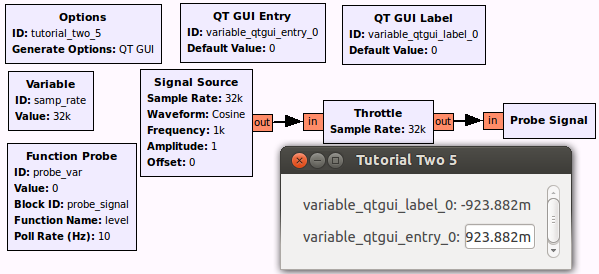
We see that there are a bunch of sinks, which again we cannot use in this case. That leaves us with the GUI Widgets which are six options. But we know that four of them sound like inputs and so don't make much sense (though we can use them if you remember to experiment!). That leaves QT GUI Entry and QT GUI Label and either will display the data if we simply change the Default Value to the ID of our Function Probe block which is "probe_var". Result is below:
A Note on the Throttle Block
Before we delve further, we need to discuss the Throttle Block we used in all of our flowgraphs. Below is a comparison on System Monitor that shows running the sine wave flowgraph with throttle and without throttle.
As we can see, not using a throttle block and not connected to hardware forces our CPU to run at full speed! We always use a throttle when not connected to hardware. And we only need one throttle block in the entire flowgraph even if we have multiple sources/sinks. We can think of the throttle block as the speed limit: higher rate means our flowgraph goes faster while slower rate means it goes slower. If we change the throttle sample rate to something really high like 1e6 then we can open up our system monitor again and see that our CPU works a lot harder than it does at 48e3. On the other hand hardware imposes a restriction on the throughput therefore it requires no throttle block. Again, we never use a throttle block when connected to hardware.
if hardware:
     do_not_use_throttle
else:
     use_one_throttle
Sampling Rate Mismatch
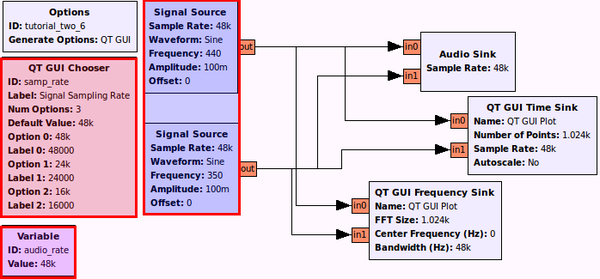
Now that we have introduced hardware which requires certain sampling rates to function properly, we can go over an example with sampling rate mismatch. Let's build the following flowgraph:
- Configuring the Chooser to allow three different values for the sampling rate of the signal. Though the image shows the third value as 16 kHz, make that 160 kHz instead.
- All the sources have the Sampling Rate as samp_rate
- audio_rate set to "48000"
- All the sinks (audio, time, frequency) have the sampling rate as audio_rate
We can see that there is no throttle block. We can also notice that we are keeping the audio sample rate as a variable therefore it can not be changed while the flowgraph is running. This is because the xml file doesn't have the appropriate callback to support this (more on callbacks in tutorial 3).
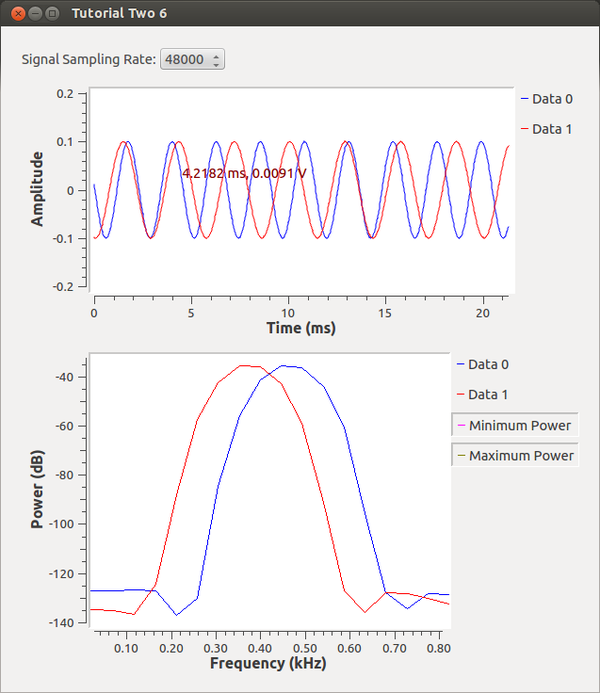
If we run the flowgraph with a sample rate of 48000 we can hear the familiar sound of a phone dailtone and see that the frequency on the fft is indeed at 440Hz and 350Hz.
No more dialtone. The soundcard receives higher frequency signals
No more dialtone. The soundcard receives lower frequency signals
It's important to ensure that sample rates always match otherwise we will be working with frequency scaled versions of our data! More info on sampling rates is available on the [FAQ#What-does-sample-rate-mean-in-GNU-Radio FAQ]
Conclusion
And that is it for now with GRC. Let us know your thoughts before going on to the python tutorial.
Some Questions We Now Know!
1. If you put down a Signal Source and Abs block onto a canvas and connect them together without changing anything, an error occurs.
1a. How do we know there is an error?
1b. How do we figure out what the error is?
1c. How do we correct the error?
2. Say that we have two signals in our flowgraph that we wish to multiply together.
2a. How would we find a block that multiplies signals?
2b. How do we use the multiply block in GRC?
2c. What else can we do and change in this block?
3. If you saw a block had an unused, light gray input port on it, what kind of port would that be?
4. If you run a flowgraph and see the "AttributeError: 'top_block_sptr' object has no attribute 'top_layout'", what is wrong and how can you fix it?
5. Signal processing questions
- Say we want to process speech audio data, and we have a microphone that won't let any frequencies in higher than 8 kHz. What is the minimum sampling rate we must use?
- Now we want to digitize a radio signal that goes from 99.9 MHz to 100.1 MHz. How large is the minimum applicable sampling rate?
6. Answers
- 16 kHz (2 * 8 kHz)
- The bandwidth is 200 kHz, so we must sample at least at 400 kHz -- or 200 kHz if we have complex sampling, as we usually do in software radios.
Links to Further Resources
Links that are accessible without knowing much about how GNU Radio interacts with code. Not necessary to proceed.
Candidates for Future Sections
Possible topics we may want to add in the future depending on feedback and questions on mailing list
- [[GNURadioCompanion#Hierarchical-Blocks|Hier Blocks Example]\
- Busports
- Samples vs Time, deserves an example but not sure if here on in python
- Maybe a simpler example like dial tone
<. Previous: Introduction >. Next: Programming GNU Radio in Python
