Python Block with Vectors: Difference between revisions
Mattcarrick (talk | contribs) |
Mattcarrick (talk | contribs) |
||
| Line 110: | Line 110: | ||
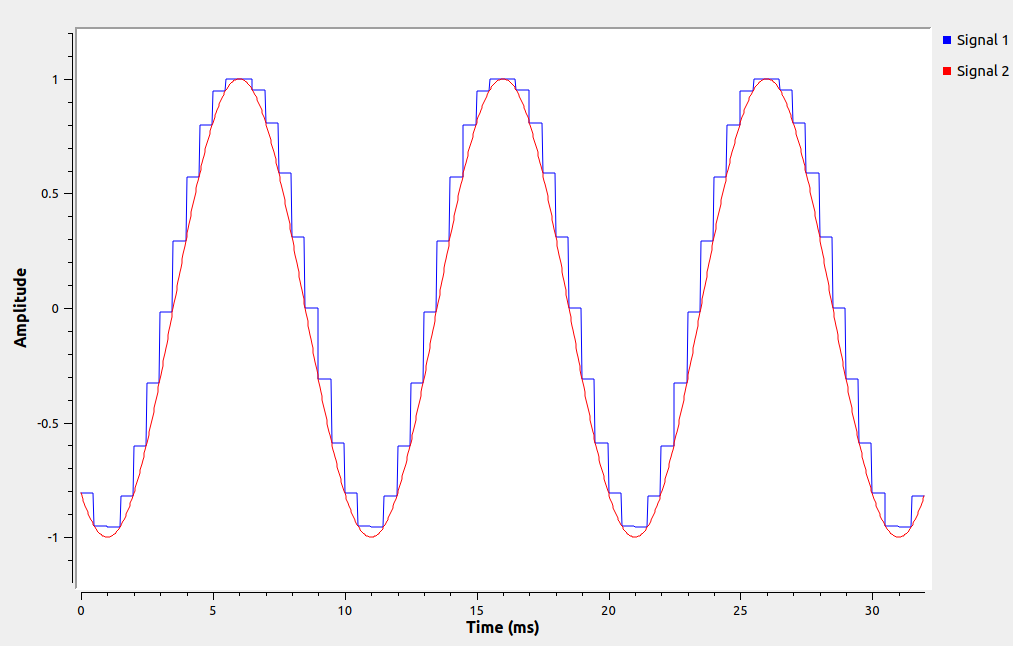
Save the code (CTRL + S). Run the flowgraph. The output will now show a sinusoid and a sinusoid with a max-hold applied every 16 samples: | Save the code (CTRL + S). Run the flowgraph. The output will now show a sinusoid and a sinusoid with a max-hold applied every 16 samples: | ||
[[File:MaxHoldOutput.png]] | |||
Revision as of 15:24, 31 January 2022
This tutorial describes how the Python Embedded Block can be modified to accept vector inputs and outputs, and how the input_items vector indexing is different between vectors and streams.
The previous tutorial, Creating Your First Block, demonstrates how to create a Python block using the Embedded Python Block. The next tutorial, Python Block Message Passing describes how to send and receive messages using the Embedded Python Block.
Starting the Flowgraph
This tutorial uses vectors, please complete the Streams and Vectors tutorial before moving on.
Add the following blocks to the flowgraph:
- Signal Source
- Throttle
- Stream to Vector
- Embedded Python Block
- Vector to Stream
- QT GUI Time Sink (two copies)
- Variable
Modify the following block properties:
- Signal Source, Frequency: 100
- Variable
- Id: vectorLength
- Value: 16
- Stream to Vector, Num Items: vectorLength
- Vector to Stream, Num Items: vectorLength
- QT GUI Time Sink (both copies), Autoscale: Yes
Connect the blocks according to the following flowgraph:
Accepting Vector Inputs and Outputs
The Embedded Python Block needs to be modified to accept vector inputs, produce vector outputs and change the data type to float. Double-click on the block to edit the source code.
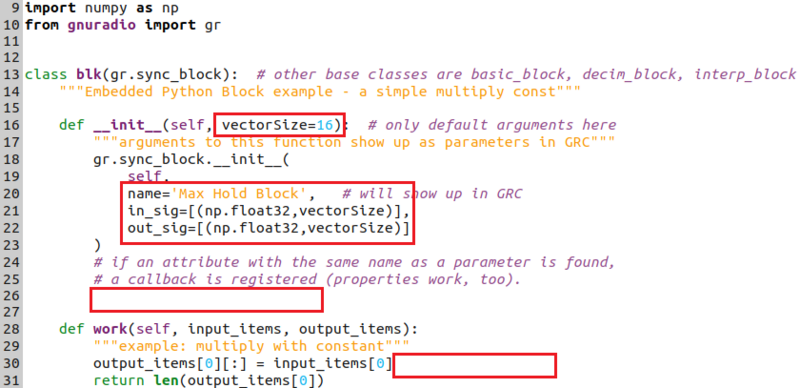
Change example_param in the function definition to vectorSize:
def __init__(self, vectorSize=16):
Change the name:
name='Max Hold Block',
Define the input and output to be a tuple enveloped by a list:
in_sig=[(np.float32,vectorSize)],
out_sig=[(np.float32,vectorSize)]
Remove the self.example_param = example_param line.
Remove the multiplication by self.example_param:
output_items[0][:] = input_items[0]
The code should now look like the following:
Save the code (CTRL + S). Connect the Max Hold Block to the rest of the flowgraph:
Warning for Vector Length Mismatches
The Embedded Python Block has one quirk that other Out of Tree Modules do not have. Before a flowgraph can be run GRC checks to ensure all of the connected data types and vector sizes match. During this process the default value of vectorSize in the __init()__,
def __init__(self, vectorSize=16):
is used to define the size of the vectors for the input and output,
in_sig=[(np.float32,vectorSize)],
out_sig=[(np.float32,vectorSize)]
when determining if the flowgraph is correct. In this case since vectorSize=16, GRC will assume the input and output ports will be vectors with length 16, even if the parameter passed in through the block properties!
- show examples of both types of mismatch
Warning! The flowgraph will show an error if the length of the vector in your block definition does not match the vector sizes of the other blocks! Since there is not a syntax error the Embedded Python Block will not report an error in the properties window. Instead the only indication of an error will be that the blocks will not connect:
Indexing Vectors
Vectors add an additional dimension, represented as vectorIndex below, onto both input_items and output_items:
input_items[portIndex][vectorIndex][sampleIndex]
output_items[portIndex][vectorIndex][sampleIndex]
- TODO: put an image here
Creating Max Hold Function
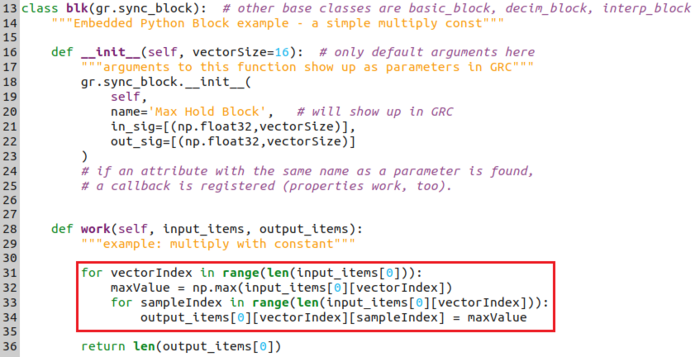
The work() function needs to be modified to include the max hold function. Add a loop over all of the vectors in input_items[0]:
for vectorIndex in range(len(input_items[0])):
Calculate the max value of the vector:
maxValue = np.max(input_items[0][vectorIndex])
Loop over each of the input samples:
for sampleIndex in range(len(input_items[0][vectorIndex])):
Assign each output sample maxValue:
output_items[0][vectorIndex][sampleIndex] = maxValue
The code should look like the following:
Save the code (CTRL + S). Run the flowgraph. The output will now show a sinusoid and a sinusoid with a max-hold applied every 16 samples:


