Guided Tutorial PSK Demodulation: Difference between revisions
(Phase and Fine Frequency Correction - add link to flowgraph) |
(→Notes) |
||
| Line 26: | Line 26: | ||
== Notes == | == Notes == | ||
The current tutorial has been updated for GNU Radio version 3. | The current tutorial has been reviewed and updated for GNU Radio version 3.10. The 'CMA Equalizer' and 'LMS DD Equalizer' were deprecated in 3.9 and have been removed in version 3.10. They have been replaced by the [[Linear_Equalizer]] and [[Adaptive_Algorithm]]. | ||
It is intended that the reader study the flowgraphs and resulting output, but not necessarily build each one. | It is intended that the reader study the flowgraphs and resulting output, but not necessarily build each one. However, links to the GRC source files are included. | ||
== Transmitting a Signal == | == Transmitting a Signal == | ||
Revision as of 13:06, 12 April 2023
In this tutorial, we will be focused on simulation rather than over-the-air transmission. It will discuss many of the issues involved with what goes on when transmitting and receiving signals with real hardware and channel effects. We will go through setting up our simulation and then step-by-step how to recover the signal.
During the tutorial, keep in mind that this is just one way of handling digital signal reception. There are various algorithms and methods that have been designed for these steps, and different types of digital signals will behave differently. Here, we go through a set of stages and use of algorithms readily available in GNU Radio for PSK signal reception and demodulation. This tutorial, however, should in no way be meant to suggest that this is the only way to accomplish this task.
Objectives
- Understand issues of signal distortion and channel effects.
- Recognize the stages required to recover signals.
- Timing recovery
- Multipath channels
- Phase and frequency correction
- Decoding symbols and bit ordering
Prerequisites
- References:
- Our Suggested Reading list
- The ARRL Handbook Section 11.5 Quadrature Modulation
- f. j. harris and M. Rice, "Multirate Digital Filters for Symbol Timing Synchronization in Software Defined Radios", IEEE Selected Areas in Communications, Vol. 19, No. 12, Dec., 2001. [1]
- Where to get help
Notes
The current tutorial has been reviewed and updated for GNU Radio version 3.10. The 'CMA Equalizer' and 'LMS DD Equalizer' were deprecated in 3.9 and have been removed in version 3.10. They have been replaced by the Linear_Equalizer and Adaptive_Algorithm.
It is intended that the reader study the flowgraphs and resulting output, but not necessarily build each one. However, links to the GRC source files are included.
Transmitting a Signal
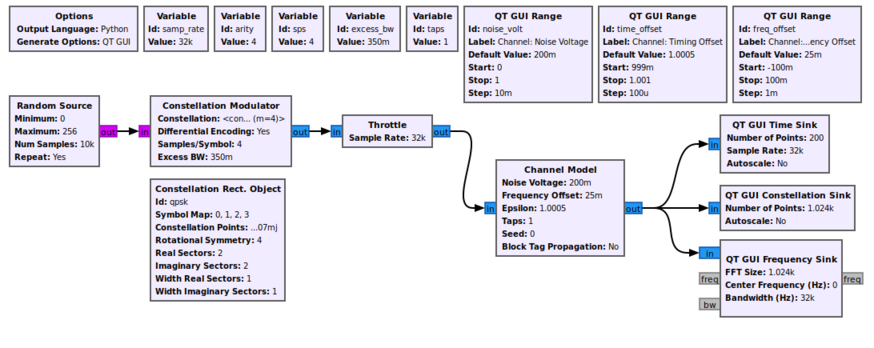
The first stage is transmitting the QPSK signal. We generate a stream of bits and modulate it onto a complex constellation. To do this, we use the Constellation Modulator block, which uses a Constellation Rect. Object and other settings to control the transmitted signal. The Constellation parameter of the Constellation Modulator is the id of the Constellation Rect. Object (qpsk_const), even though it shows on the flowgraph as something else.
The constellation object allows us to determine how the symbols are coded. The modulator block can then use this modulation scheme with or without differential encoding. The constellation modulator expects packed bytes, so we have a random source generator providing bytes with values 0 - 255.
When dealing with the number of samples per symbol, we want to keep this value as small as possible (minimum value of 2). Generally, we can use this value to help us match the desired bit rate with the sample rate of the hardware device we'll be using. Since we're using simulation, the samples per symbol is only important in making sure we match this rate throughout the flowgraph. We'll use 4 here, which is greater than what we need, but useful to visualize the signal in the different domains.
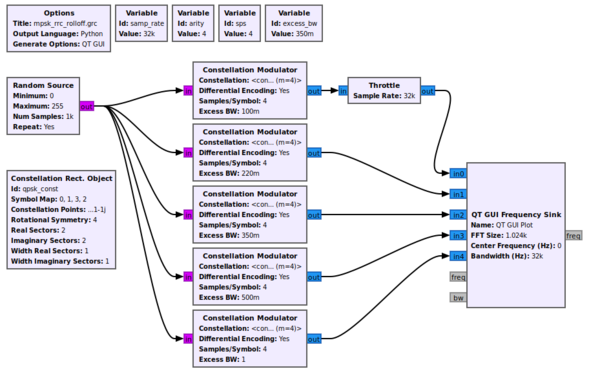
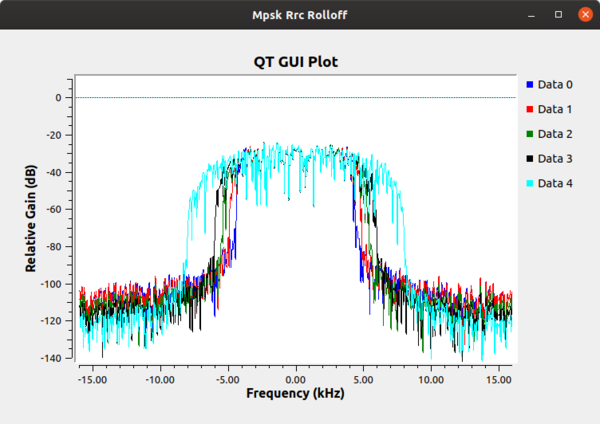
Finally, we set the excess bandwidth value. The constellation modulator uses a root raised cosine (RRC) pulse shaping filter, which gives us a single parameter to adjust the roll-off factor of the filter, often known mathematically as 'alpha'. The mpsk_rrc_rolloff.grc flowgraph below generates the following figure showing different values of the excess bandwidth. Typical values are between 0.2 (red trace) and 0.35 (green trace).
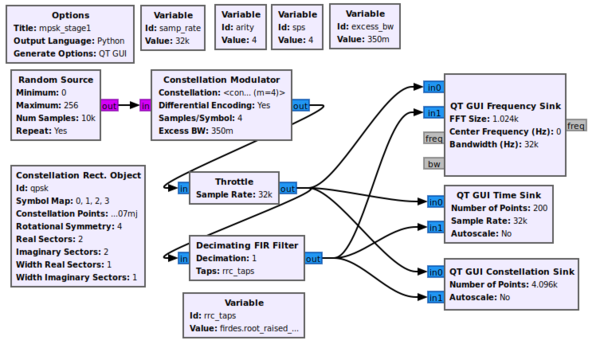
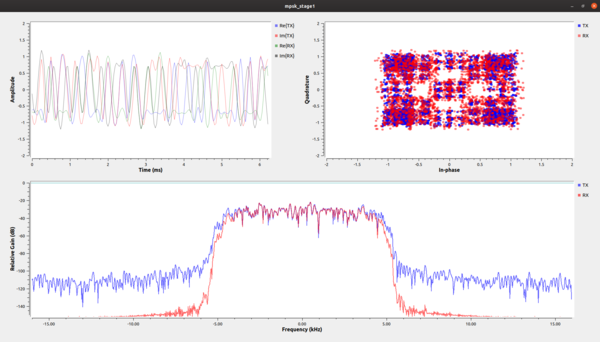
The example flowgraph mpsk_stage1.grc transmits a QPSK constellation. It plots both the transmitted signal and part of the receiver chain in time, frequency, and the constellation plot. The variable rrc_taps value is firdes.root_raised_cosine(1.0,samp_rate,samp_rate/sps,excess_bw,11*sps).
In the constellation plot, we see the effects of the up-sampling (generating 4 samples per symbol) and filtering process. In this case, the RRC filter adds intentional self-interference, known as inter-symbol interference (ISI). ISI is bad for a received signal because it blurs the symbols together. We'll look into this in-depth during the timing recovery section. Right now, let's just see what we're doing to the signal. If you are just looking at the transmitted signals from this graph, then you should see that the frequency plot is showing a signal with a nice shape to it and that rolls-off into the noise. If we didn't put a shaping filter on the signal, we would be transmitting square waves that produce a lot of energy in the adjacent channels. By reducing the out-of-band emissions, our signal now stays nicely within our channel's bandwidth.
On the receive side, we get rid of ISI by using another filter. Basically, what we've done is purposefully used a filter on the transmitter, the RRC filter, that creates the ISI. But when we convolve two RRC filters together, we get a raised cosine filter, which is a form of a Nyquist filter. So, knowing this property of the transmit RRC filter, we can use another RRC filter at the receiver. Filtering is just a convolution here, so the output of the receive-side RRC filter is a raised cosine pulse shaped signal with minimized ISI. The other benefit is that, absent effects of the channel, what we are doing is using a matched filter at the receiver.
Adding Channel Impairments
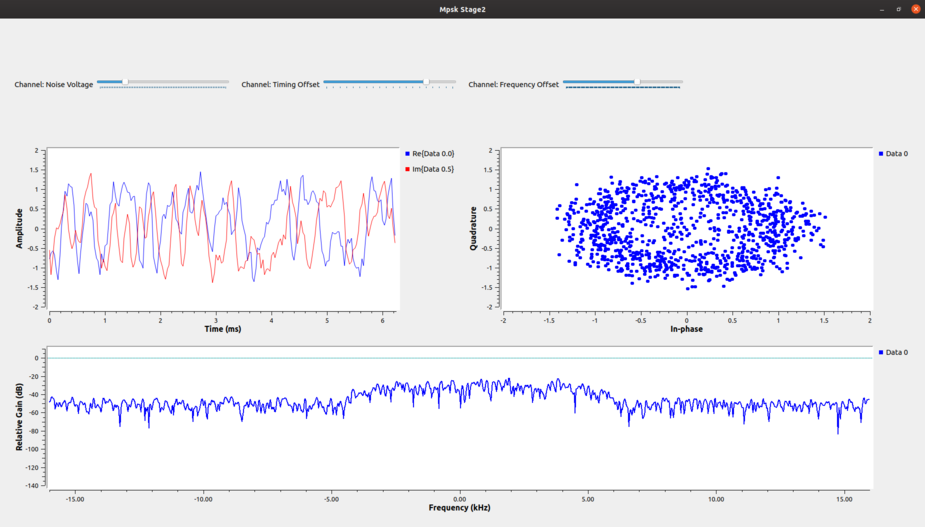
That first stage example only dealt with the mechanics of transmitting a QPSK signal. We'll now look into the effects of the channel and how the signal is distorted between when it was transmitted and when we see the signal in the receiver. The first step is to add a channel model, which is done using the example mpsk_stage2.grc below. To start with, we'll use the most basic Channel Model block of GNU Radio.
This block allows us to simulate a few main issues that we have to deal with. The first issue with receivers is noise. Thermal noise in our receiver causes noise that we know of as Additive White Gaussian Noise (AWGN). We set the noise power by adjusting the noise voltage value of the channel model. We specify the voltage here instead of power because we need to know the bandwidth of the signal in order to calculate the power properly. One of the defining aspects of GNU Radio is the independence of the blocks, so the channel model doesn't know anything about the incoming signal. We can calculate the noise voltage from a desired power level knowing the other parameters of the simulation.
Another significant problem between two radios is different clocks, which drive the frequency of the radios. The clocks are, for one thing, imperfect, and therefore different between radios. One radio transmits nominally at fc (say, 450 MHz), but the imperfections mean that it is really transmitting at fc + f_delta_1. Meanwhile, the other radio has a different clock and therefore a different offset, f_delta_2. When it's set to fc, the real frequency is at fc + f_delta_2. In the end, the received signal will be f_delta_1 + f_delta_2 off where we think it should be (these deltas may be positive or negative).
Related to the clock problem is the ideal sampling point. We've up-sampled our signal in the transmitter and shaped it, but when receiving it, we need to sample the signal at the original sampling point in order to maximize the signal power and minimize the inter-symbol interference. Like in our stage 1 simulation after adding the second RRC filter, we can see that among the 4 samples per symbol, one of them is at the ideal sampling point of +1, -1, or 0. But again, the two radios are running at different speeds, so the ideal sampling point is an unknown.
The second stage of our simulation allows us to play with these effects of additive noise, frequency offset, and timing offset. When we run this graph we have added a bit of noise (0.2), some frequency offset 0.025), and some timing offset (1.0005) to see the resulting signal.
The constellation plot shows us a cloud of samples, far worse that what we started off with in the last stage. From this received signal, we now have to undo all of these effects.
Recovering Timing
Now we'll walk through the recovery process. Keep in mind that there are many algorithms we could use for recovery of each stage. Some can do joint recovery of multiple stages at the same time. We will use the polyphase clock recovery algorithm here.
We will start off with timing recovery. We're trying to find the best time to sample the incoming signals, which will maximize the Signal to Noise Ratio (SNR) of each sample as well as reduce the effects of Inter Symbol Interference (ISI).
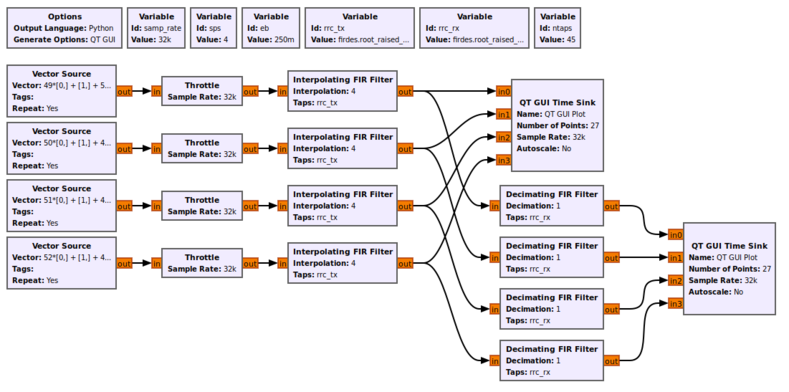
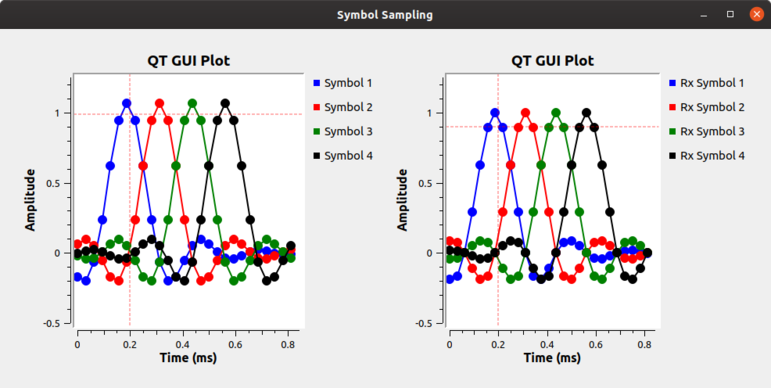
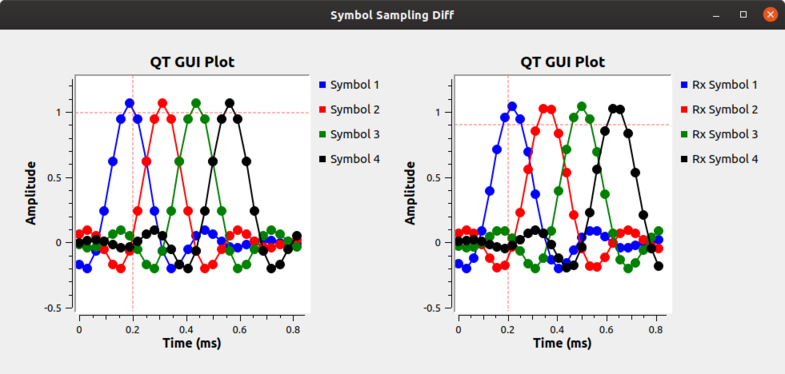
We can illustrate the ISI problem using the example flowgraph symbol_sampling.grc where we simply create four separate symbols of 1's in a row and then filter them. The first stage of filtering performs up-sampling to the 'sps' samples per symbol and uses a root raised cosine filter. We follow this with another root raised cosine filter that does no rate changes. The second RRC filter here converts the signals from using the non-Nyquist RRC filter to a Nyquist raised cosine (RC) filter as we discussed in the first stage of this tutorial. The output, shown in the figures below, shows the differences between the RRC- and RC-filtered symbols. Without Nyquist filtering, we can see how at the ideal sampling point of each symbol, the other symbols have some energy. If we summed these symbols together like we would in a continuous stream of samples, the energy of those other samples add together and distort the symbol at that point. Conversely, in the RC filtered output, the energy from the other samples are at 0 at the ideal sampling point for the given symbol in time. That means that if we sample at exactly the correct sample point, we only get energy from the current symbol with no interference from the other symbols in the stream. Again, what we're seeing is how the timing recovery applies a matched filter to satisfy the Nyquist ISI criterion.
This simulation allows us to adjust things easily like the number of samples per symbol, excess bandwidth of the RRC filters, and the number of taps. Then we can play with these different values to see how they affect the behavior of the sampling point.
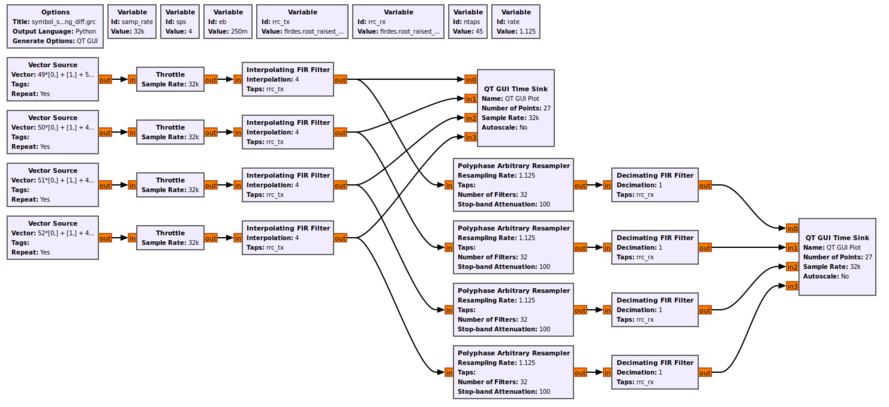
Next, let's look at what happens due to the different clocks affecting the sampling points between the transmitter and receiver. Using the example flowgraph in symbol_sampling_diff.grc, we simulate the effect of the different clocks in the transmitter and receiver. Each clock is imperfect and so (a) will start at a different point in time and (b) drift relative to the other clocks. We simulate this by adding a resampler that adjusts the symbol sampling time slightly between the transmitted signal (in the transmit image above) and the receiver, shown below. The clock difference shown here of 1.125 is extreme as a way of showing it in this setup as a visualization technique. In reality, timing differences are on the order of a few parts per million. But here, notice that with the samples being collected at different points in time, the ideal sampling period is not known and any sampling done will also include ISI.
Our task here is to synchronize the transmit and receiver clocks using only information at the receiver from the incoming samples. This job is known as clock or timing recovery.
Details of the Polyphase Clock Sync Block
There are various algorithms that we can use to recover the clock at the receiver, and almost all of them involve some kind of feedback control loop. Those that don't are generally data aided using a known word like a preamble. We'll use a polyphase filterbank clock recovery technique that can be found in Multirate Signal Processing for Communications Systems by fred harris [2]. This block does three things for us. First, it performs the clock recovery. Second, it does the receiver matched filter to remove the ISI problem. Third, it down-samples the signal and produces samples at 1 sps.
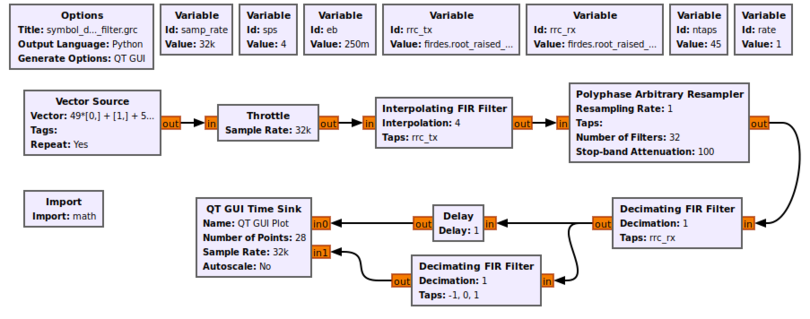
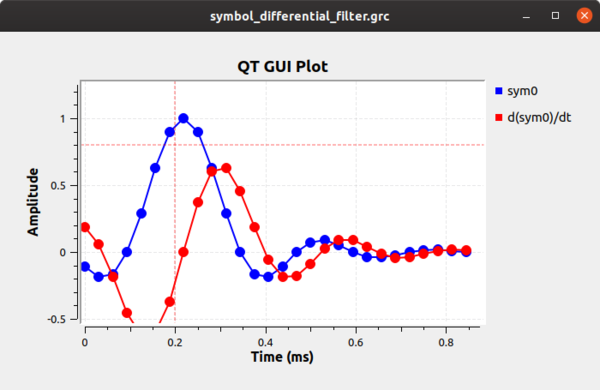
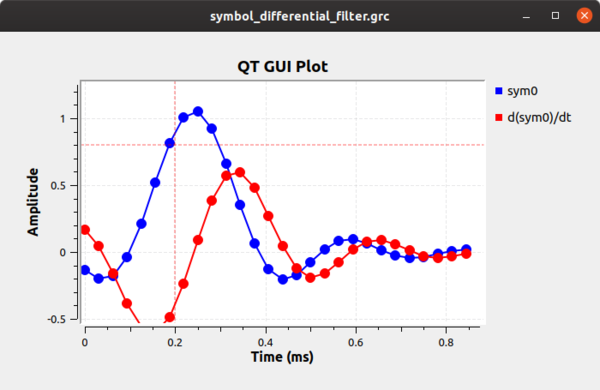
The block works by calculating the first differential of the incoming signal, which will be related to its clock offset. If we simulate this very simply at first, we can see how the differential filter will work for us. First, using the example flowgraph symbol_differential_filter.grc, we can see how everything looks perfect when our rate parameter is 1 (i.e., there is no clock offset). The sample we want is obviously at 0.22 ms. The difference filter ([-1, 0, 1]) generates the differential of the symbol, and as the following figure shows, the output of this filter at the correct sampling point is 0. We can then invert that statement and instead say when the output of the differential filter is 0 we have found the optimal sampling point.
What happens when we have a timing offset? That output is shown below shows that the timing offset where the peak of the symbol is off and the derivative filter does not show us a point at zero.
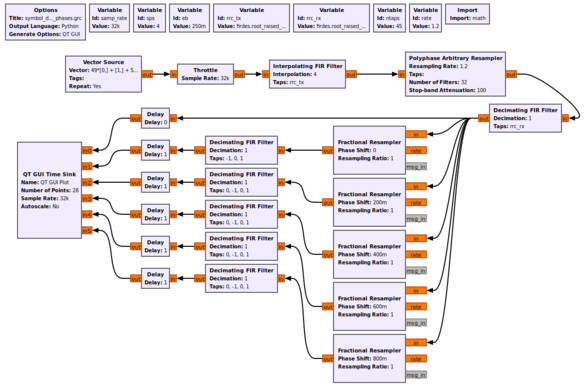
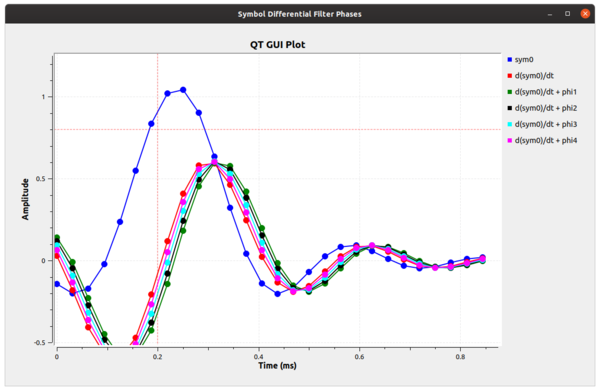
Instead of using a single filter, what we can do is build up a series of filters, each with a different phase. If we have enough filters at different phases, one of them is the correct filter phase that will give us the timing value we desire. Let's look at a simulation that builds 5 filters, which means 5 different phases. Think of each filter as segmenting the unit circle (0 to 2pi) into 5 equal slices. Using the example flowgraph symbol_differential_filter_phases.grc, we can see how this helps us. Notice here that we are using the fractional resampler here because it makes it easy to do the phase shift (between 0 and 1), but it also changes the filter delays of the signals, so we correct for that using the follow-on delay blocks.
The figure below now gives us an idea of what we're dealing with, although it's a bit inexact. What we can see is that the signal labeled as d(sym0)/dt + phi3 has a sample point at 0. This tells us that our ideal sampling point occurs at this phase offset. Therefore, if we take the RRC filter of our receiver and adjust its phase by phi3 (which is 3*2pi/5), then we can correct for the timing mismatch and select the ideal sampling point at this sample time.
But as we have discussed, this is only a simulated approximation; in reality, the samples of each filter wouldn't occur at the same point in time. We have to up-sample by the number of filter (e.g., 5) to really see this behavior. However, that can clue us into what's happening a bit farther. We can look at these different filters as parts of one big filter that is over-sampled by M, where M=5 in our simple example here. We could up-sample our incoming signal by this much and select the point in time where we get the 0 output of the difference filter. The trouble with that is we are talking about a large amount of added computational complexity, since that is proportional to our sample rate. Instead, we're working on filters of different phases at the incoming sample rate, but with the bank of them at these different phases, we can get the effect of working with the over-sampled filter without the added computational cost.
So in our example above, we offset our sampling rate by some known factor of 1.2 and found that we could use one of five filters as the ideal sampling point. Unfortunately, we really only have 5 different phases we can exactly produce and correct for here. Any sampling offset between these phases will still produce a mistimed sample with added ISI as we explored previously. So instead, we use way more than 5 filters in our clock recovery algorithm. Without exploring the math (see harris' book referenced above), we can use 32 filters to give us a maximum ISI noise factor that is less than the quantization noise of a 16 bit value. If we want more than 16 bits of precision, we can use more filters.
So what? We have a large bank of filters where one of them is at (or very close to) the ideal sampling phase offset. How do we automatically find that? Well, we use a 2nd order control loop, like we almost always do in these recovery situations. The error signal for the recovery is the output of the differential filter. The control loop starts at one of the filters and calculates the output as the error signal. It then moves its way up or down the bank of filters proportionally to the error signal, and so we're trying to find where that error signal is closest to 0. This is our optimal filter for the sampling point. And because we expect the transmit and receive clocks to drift relative to each other, we use a second order control loop to acquire both the correct filter phase as well as the rate difference between the two clocks.
GNU Radio comes with an example found in the digital examples directory called example_timing.py. You can run this script on your own to see the convergence behavior of the Polyphase Clock Sync recovery block.
Using the Polyphase Clock Sync Block in Our Receiver
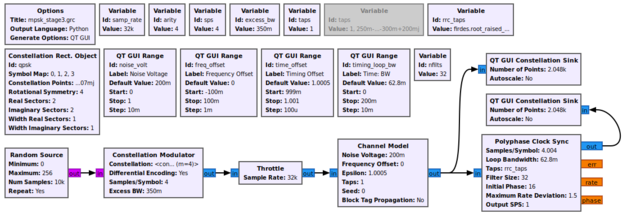
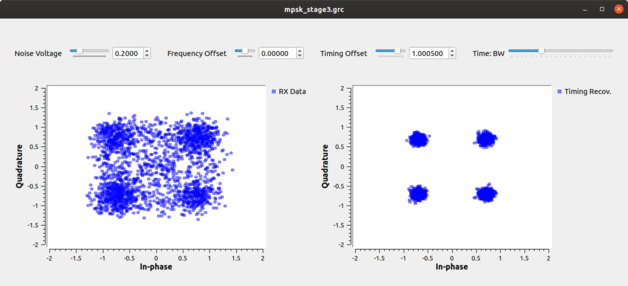
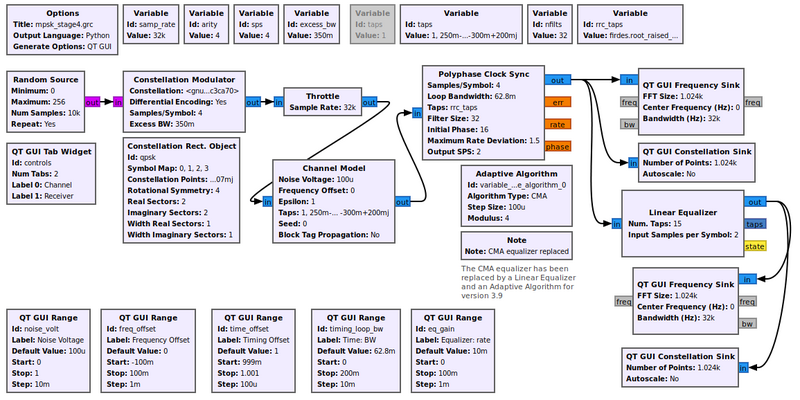
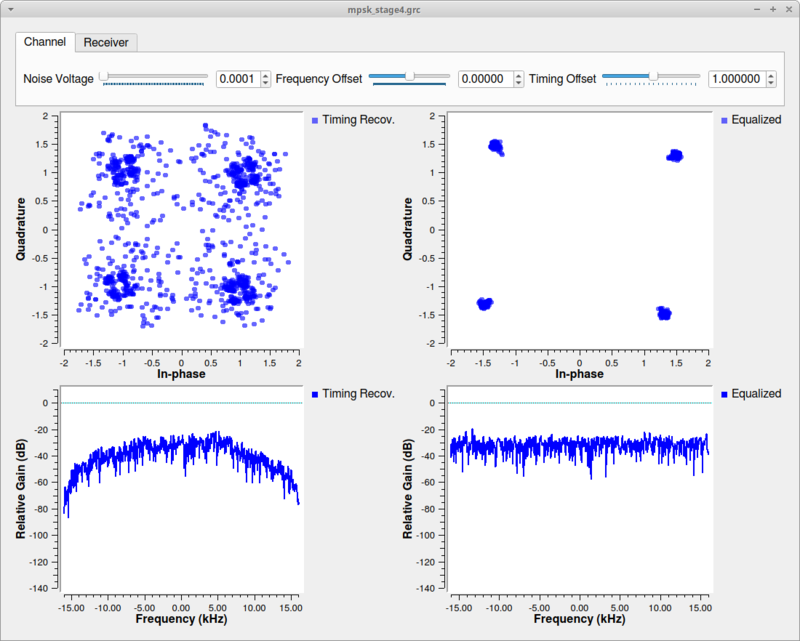
Now let's put this block to use in our simulation. The example flowgraph mpsk_stage3.grc takes the output of the channel model and passes it through our Polyphase Clock Sync block. This block is setup with 32 filters, for the reasons we discussed above, and a loop bandwidth of 2pi/100. The block also takes in a value for the expected samples per symbol, but this is just our guess at what we think this value should be. Internally, the block will adapt around this value based on the rates of the incoming signal. Notice, however, that I have set this simulation up where the estimate is slightly off of the 4 sps we transmit with. This is to simulate an initial timing offset between the transmitter and receiver since we initialize our Timing Offset control to 1.0. It makes things slightly harder so that we can observe the convergence of the constellation.
When running this script, we see the constellation on the left as the received signal before timing recovery and on the right after timing recovery. It's still a little noisy as a result of the ISI after the 32 filters, which is quickly absorbed by noise once we adjust the channels Noise Voltage setting to be more than 0.
We can then play around with changing the timing and frequency offset. Moving the timing bar around shows us how the clock sync block keeps the signal locked in time and outputs samples at (or very near) the ideal constellation points. When we add frequency offset, we can see that the constellation becomes a circle. The constellation is still on the unit circle, so we know that it's still keeping the correct timing, but the block isn't allowing us to correct for a frequency offset. We still need to handle this, but later.
Likewise, we can change the multipath simulation environment by changing which version of the taps variable we use. Adding multipath will show us that the clock recovery block is robust to multipath but won't correct for it, so again, we need something else to handle that.
Multipath
Let's first understand what multipath is. There is already quite a lot written on the subject of multipath, we'll just explore it enough here to get a general sense of where it comes from and how it affects our communications capabilities. We won't be going into details about real fading channels or how to analyze their properties.
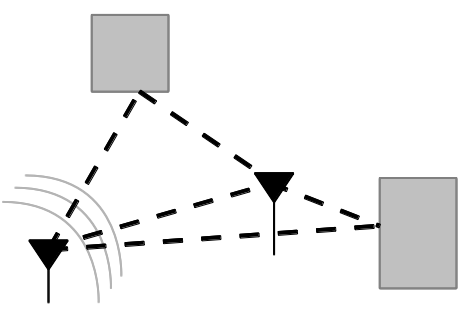
Multipath results from that fact that in most communication environments, we don't have a single path for the signal to travel from the transmitter to the receiver. Like the cartoon below shows, any time there is an object that is reflective to the signal, a new path can be established between the two nodes. Surfaces like buildings, signs, trees, people, etc. can all produce signal reflections. Each of these reflective paths will show up at the receiver at different times based on the length of the path. Summing these together at the receiver causes distortions, both constructively and destructively.
The impact of the combination of these signals at the receiver is distortions of the signal. If the difference in time between reflections is small enough relative to the width of the symbol, the distortion can be within the symbol -- intra-symbol interference. When the reflections are longer than the symbol time, the reflection from one symbol will affect the signals following -- another reason for inter-symbol interference.
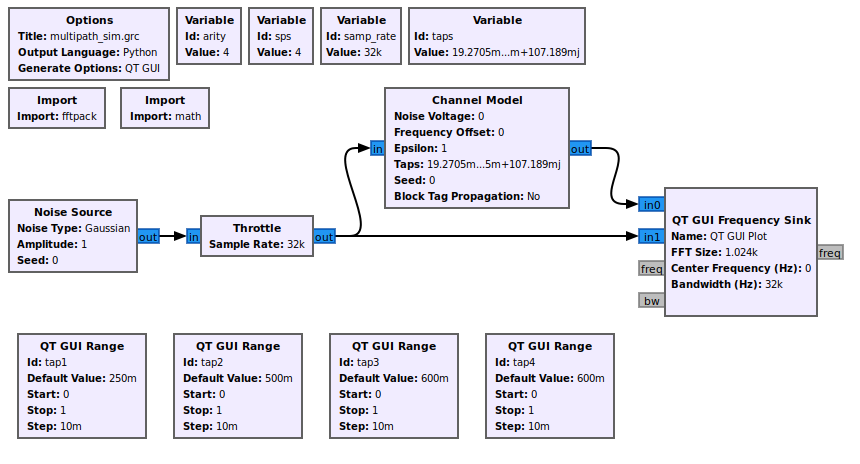
We need to correct for this behavior, and we can do so using a mechanism very much like a stereo equalizer. In fact, we call them equalizers. With a stereo equalizer, we can change the gain of certain frequencies to either suppress or enhance those signals -- bass and treble being the common ones. I've created a very simple example called multipath_sim.grc to help us explore what this looks like in the frequency domain.
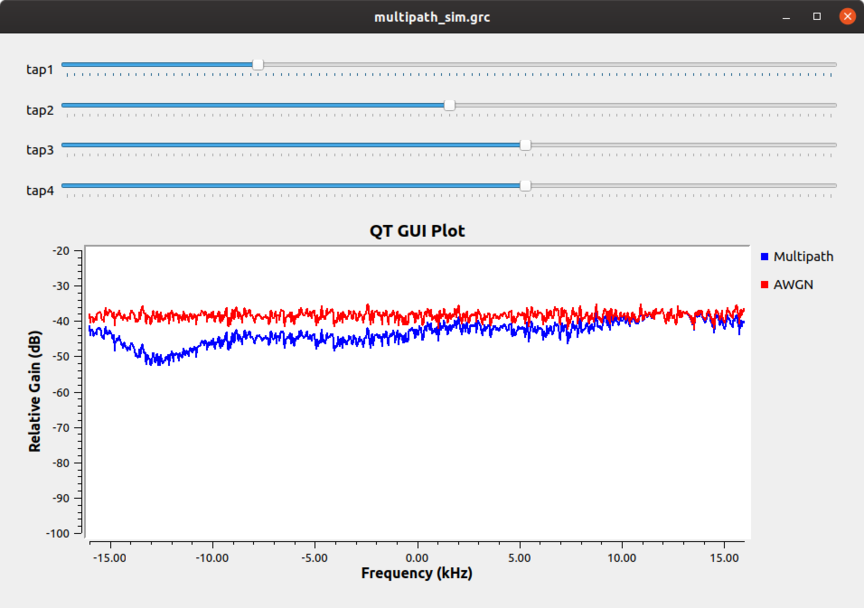
This simulation sets up a channel model to provide a channel with five equalizer controls, four of which we can change. These controls are set up equally in frequency and we can adjust them from 0 to 1. At a value of 1, the control will allow those frequencies to pass without hindrance. At a value of 0, they will produce a deep null in the spectrum, which will affect all those frequencies around it. The frequency plot is set to average.
While in this example, we are controlling the frequency domain explicitly, what we're really playing with is the ability to create an equalizer that can correct or adjust the frequency response of a received signal. Ultimately, the goal is shown in the figure below where the multipath channel is creating some distortion in the signal as shown in the frequency domain. The task of the equalizer is to invert that channel. Basically, we want to undo the distortion that's caused by the channel such that the output of the equalizer is flat. But, instead of adjusting the taps by hand, we have algorithms that update these taps for us. Our job is to use the right equalizer algorithm and set up the parameters. One important parameter here is the number of taps in the equalizer. As we can see in our simulation, five taps gives fairly coarse control over the frequency response. Alternatively, the more taps, the more time it takes to both compute the taps as well as run the equalizer against the signal.
Equalizers
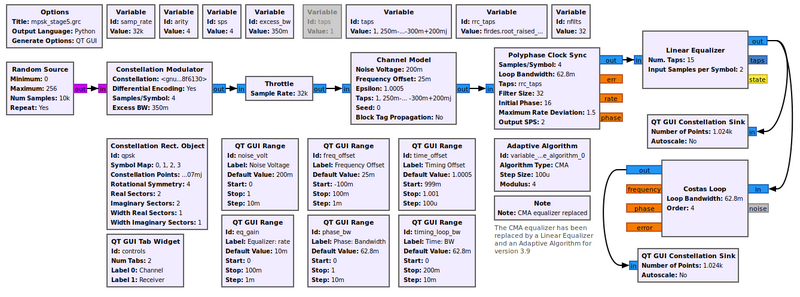
The CMA Equalizer and LMS DD Equalizer have been deprecated in 3.9 and will be removed in a future release. They have been replaced by the Linear_Equalizer and Adaptive_Algorithm. The Adaptive Algorithm has a CMA algorithm type, so it works as a direct replacement for the CMA Equalizer. The CMA, or Constant Modulus Algorithm, is a blind equalizer, but it only works on signals that have a constant amplitude, or modulus. This means that digital signals like MPSK are good candidates since they have points only on the unit circle (think back to the experiment we did where we locked the signal timing but had a frequency offset; what we were seeing was the unit circle). The mpsk_stage4.grc flowgraph illustrates this point. Note: clicking the link will download the GRC file.
We can watch the CMA algorithm converge. Note, too, that since we have both a clock sync and equalizer block, they are converging independently, but the one stage will affect the next stage. So there is some interaction going on here while both are locking on to the signal. In the end, though, we can see the effect of the time-locked multipath signal before and after the equalizer. Before the equalizer, we have a very ugly signal, even without noise. The equalizer nicely figures out how to invert and cancel out this channel so that we have a nice, clean signal again. We can also see the channel itself and how it flattens out nicely after the equalizer.
Play with the taps provided to the channel model block to change the multipath. The current taps were simply randomly generated to provide a multipath profile with no real mathematical basis for them. For more complex channel models with fading simulations, see the Channel Models page in the GNU Radio manual.
Phase and Fine Frequency Correction
Given that we've equalized the channel, we still have a problem of phase and frequency offset. Equalizers tend not to adapt quickly, and so a frequency offset can be easily beyond the ability of the equalizer to keep up. Also, if we're just running the CMA equalizer, all it cares about is converging to the unit circle. It has no knowledge of the constellation, so when it locks, it will lock at any given phase. We now need to correct for any phase offset as well as any frequency offset.
Two things about this stage. First, we'll use a second order loop so that we can track both phase and frequency (which is the derivative of the phase) over time. Second, the type of recovery we'll deal with here assumes that we are doing fine frequency correction. So we must be sure that we are already within a decent range of the ideal frequency. If we are too far away, our loop here won't converge and we'll continue to spin. There are ways to do coarse frequency correction, but we won't get getting into those here.
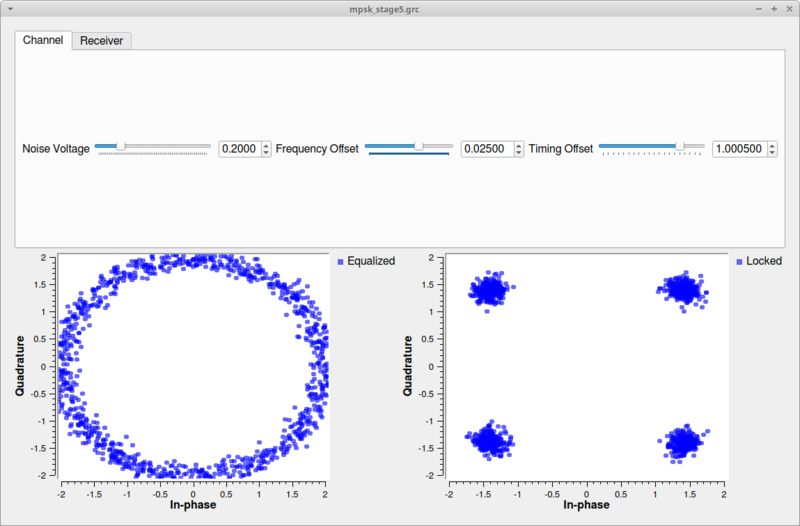
For this task, we're going to use the Costas Loop in example mpsk_stage5.grc. The Costas Loop block can synchronize BPSK, QPSK, and 8PSK. Like all of our others, it uses a second order loop and is therefore defined with a loop bandwidth parameter. The other thing it needs to know is the order of the PSK modulation, so 2 for BPSK, 4 for QPSK, and 8 for 8PSK.
In the next image, we have set noise, timing offset, a simple multipath channel, and a frequency offset. After the equalizer, we can see that the symbols are all on the unit circle, but rotating due to the frequency offset that nothing is yet correcting for. At the output of the Costas loop block, we can see the locked constellation like we started with plus the extra noise, which we can't do anything about.
Decoding
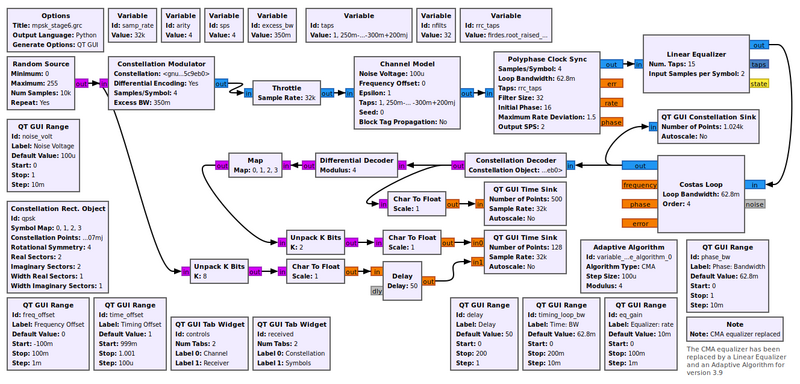
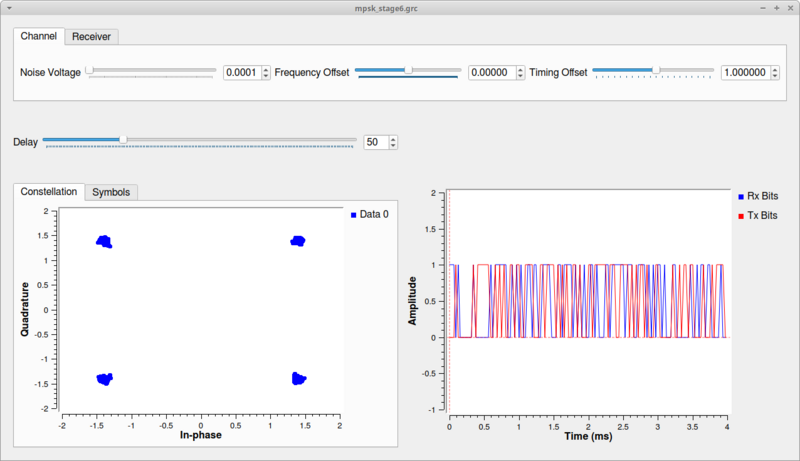
The mpsk_stage6.grc example flowgraph shown below has been updated to version 3.9.
Now that the hard part is done, we get to decode the signal. First, we insert a Constellation Decoder after the Costas loop, but our work is not quite done. At this point, we get our symbols from 0 to 3 because this is the size of our alphabet in a QPSK scheme. But, of those 0-3 symbols, how do we know for sure that we have the same mapping of symbols to constellation points that we did when we transmitted? Notice in our discussion above that nothing we did had any knowledge of the transmitted symbol-to-constellation mapping, which means we might have an ambiguity of 90 degrees in the constellation. Luckily, we avoided this problem by transmitting differential symbols. We didn't actually transmit the constellation itself, we transmitted the difference between symbols of the constellation by setting the Differential setting in the Constellation Modulator block to True. So now we undo that.
The flowgraph uses the Differential Decoder block to translate the differential coded symbols back to their original symbols due to the phase transitions, not the absolute phase itself. But even out of here, our symbols are not exactly right. This is the hardest part about demodulation, really. In the synchronization steps, we had basic physics and math on our side. Now, though, we have to interpret some symbol based on what someone else said it was. We, basically, just have to know this mapping. And luckily we do, so we use the Map block to convert the symbols from the differential decoder to the original symbols we transmitted. At this point, we now have the original symbols from 0-3, so lets unpack those 2 bits per symbol into bits using the unpack bits block. Now, we have the original bit stream of data!
But how do we know that it's the original bit stream? To do so, we'll compare to the input bit stream, which we can do because this is a simulation and we have access to the transmitted data. But of course, the transmitter produced packed bits, so we again use the unpack bit block to unpack from 8-bits per byte to 1-bit per byte. We then convert these streams to floating point values of 0.0 and 1.0 simply because our time sinks only accept float and complex values. Comparing these two directly would show us... nothing. Why? Because the receiver chain has many blocks and filters that delay the signal, so the received signal is some number of bits behind. To compensate, we have to delay the transmitted bits by the same amount using the Delay block. You can then adjust the delay to find the correct value and see how the bits synchronize. You can also subtract one signal from the other to see when they are synchronized as the output will be 0. Adding noise and other channel affects can then be easily seen as bit errors whenever this signal is not 0. Note: wait a few seconds after each change of the delay value.
As a final experiment, notice that we are using a finite length random number generator, so we should be able to see the pattern in the received signal. Using the QT GUI Time Raster Sink, set it up so that you can see this pattern. Keep in mind that the Time Raster plot samples the stream, so the resulting display might not be exactly what you would expect. But the pattern itself should be visible if you have set it up correctly.
