Runtime Updating Variables: Difference between revisions
Mattcarrick (talk | contribs) |
Mattcarrick (talk | contribs) |
||
| (11 intermediate revisions by the same user not shown) | |||
| Line 8: | Line 8: | ||
==QT GUI Range== | ==QT GUI Range== | ||
The GNU Radio block library comes with QT GUI widgets | The GNU Radio block library comes with QT GUI widgets. The widgets allow interaction and modification to a flowgraph while running. The ''QT GUI Range'' widget creates a slider bar that can be used to update a variable. | ||
Search for ''range'' in the block library: | Search for ''range'' in the block library: | ||
| Line 25: | Line 25: | ||
[[File:SetRangeProperties.png|500px]] | [[File:SetRangeProperties.png|500px]] | ||
An error message is displayed: | |||
<pre>ID "frequency" is not unique.</pre> | |||
The error message is displayed because there a variable block and the QT GUI Range are both using the name ''frequency''. This problem will be addressed shortly. Click ''OK'' to save the properties. | |||
Right click on the variable block and select ''Disable'', or press ''D'' on the keyboard: | Right click on the variable block and select ''Disable'', or press ''D'' on the keyboard: | ||
| Line 50: | Line 53: | ||
# Dragging the slider bar | # Dragging the slider bar | ||
# Entering a value | # Entering a value | ||
# Click up or down arrows | # Click up or down arrows | ||
[[File:QTGUIRangeDragSlider.png|700px]] | [[File:QTGUIRangeDragSlider.png|700px]] | ||
The frequency has been updated to -5000 which is reflected in the frequency spectrum plot. | The frequency has been updated to -5000 which is reflected in '''<span style="color:orange">orange</span>''' in the frequency spectrum plot. | ||
==QT GUI Chooser== | ==QT GUI Chooser== | ||
| Line 63: | Line 66: | ||
Update the default parameters for the ''Chooser'' block. The ''Chooser'' creates a list of options to select from while the flowgraph is running. In this example three frequencies | Update the default parameters for the ''Chooser'' block. The ''Chooser'' creates a list of options to select from while the flowgraph is running. In this example three frequencies are used: 0, 1000 and -2000. Update the following properties in the ''Chooser'' block: | ||
# ''Id'': frequency | # ''Id'': frequency | ||
| Line 74: | Line 77: | ||
# ''Label 2'': Frequency: -2000 | # ''Label 2'': Frequency: -2000 | ||
The ''Option'' field is the value of the variable, ''Label'' is a text description that | The ''Option'' field is the value of the variable, ''Label'' is a text description that is displayed in the drop-down menu. The image shows an example of the ''Option'' being highlighted in '''<span style="color:orange">orange</span>''' and the ''Label'' being highlighted in '''<span style="color:red">red</span>''': | ||
[[File:QTGUIChooserUpdateProperties.png|500px]] | [[File:QTGUIChooserUpdateProperties.png|500px]] | ||
Click ''OK'' to save the parameters. Running the flowgraph will | Click ''OK'' to save the parameters. Running the flowgraph will use the default value ''Frequency: 0'' when starting. The drop-down box in the upper left hand corner shows that frequency ''0'' has been selected. The time domain and frequency domain both show a signal with frequency ''0'': | ||
[[File:QTGUIChooserDefaultValue.png|700px]] | [[File:QTGUIChooserDefaultValue.png|700px]] | ||
| Line 89: | Line 92: | ||
The frequency is | The updated frequency is seen in the frequency spectrum: | ||
[[File:QTGUIChooserOptionSelected.png|700px]] | [[File:QTGUIChooserOptionSelected.png|700px]] | ||
Latest revision as of 19:20, 14 March 2022
| Beginner Tutorials
Introducing GNU Radio Flowgraph Fundamentals
Creating and Modifying Python Blocks DSP Blocks
SDR Hardware |
This tutorial describes how to update variables while a flowgraph is running using QT GUI Widgets.
Please review the previous tutorial, Variables in Flowgraphs, for an introduction to variables. The next tutorial, Signal Data Types, discusses data types and representing complex and real signals in GNU Radio.
QT GUI Range
The GNU Radio block library comes with QT GUI widgets. The widgets allow interaction and modification to a flowgraph while running. The QT GUI Range widget creates a slider bar that can be used to update a variable.
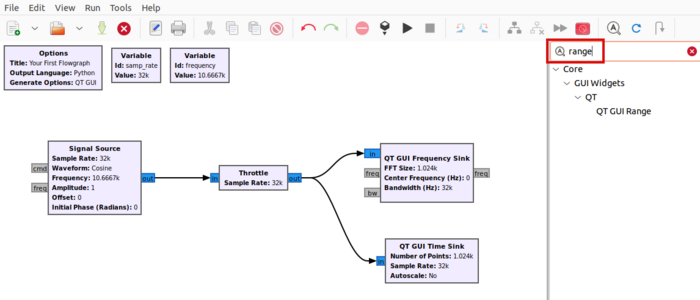
Search for range in the block library:
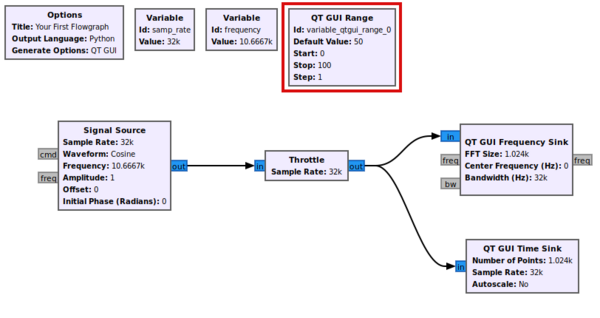
Drag and drop the QT GUI Range block into the workspace:
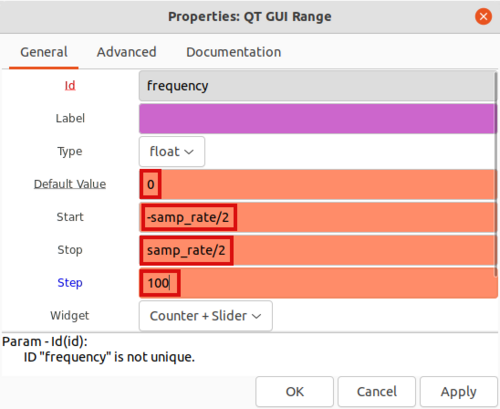
The QT GUI Range works like a variable block. The default parameters for the QT GUI Range need to be set. Double-click on the QT GUI Range block to edit the properties. The QT GUI Range block will replace the frequency variable, so first change the Id field to frequency.
The Default Value is the value when the flowgraph starts. Set the Default Value to 0. The Start and Stop are the start and stop values of the slider. Enter -samp_rate/2 as the start value and samp_rate/2 as the stop value. The Step value is the resolution of the slider. In this example the Step is set to 100 Hz:
An error message is displayed:
ID "frequency" is not unique.
The error message is displayed because there a variable block and the QT GUI Range are both using the name frequency. This problem will be addressed shortly. Click OK to save the properties.
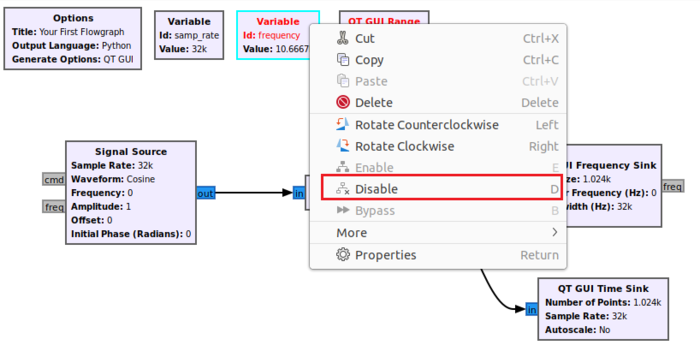
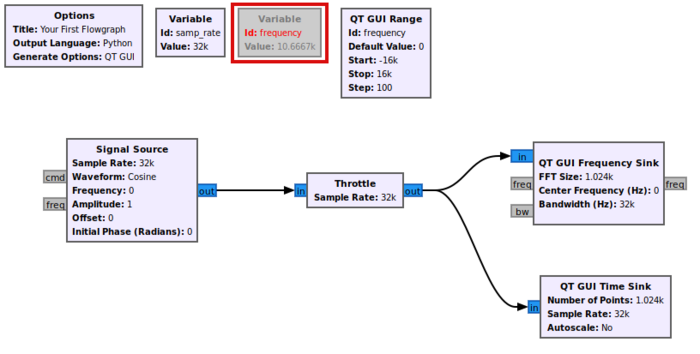
Right click on the variable block and select Disable, or press D on the keyboard:
The block is now ignored and the error is resolved.
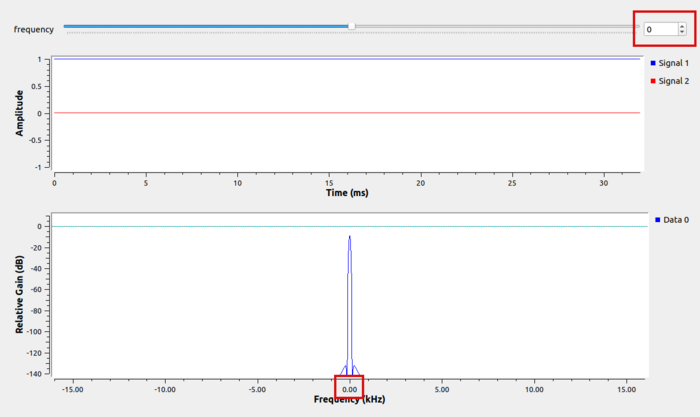
Run the flowgraph by clicking the arrow or Play button:
The flowgraph starts with a frequency of 0, the default value entered into the QT GUI Range block:
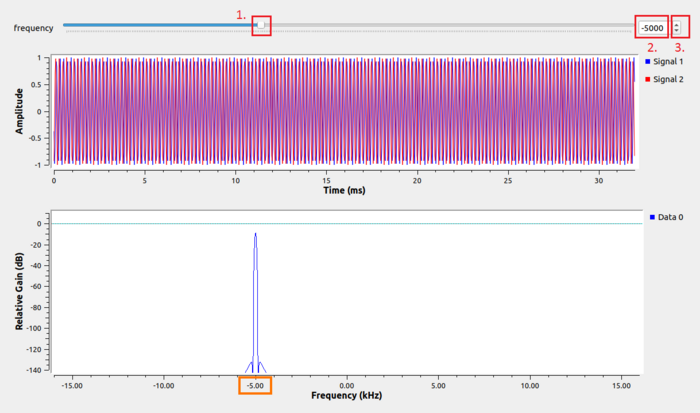
The frequency parameter can then be updated by:
- Dragging the slider bar
- Entering a value
- Click up or down arrows
The frequency has been updated to -5000 which is reflected in orange in the frequency spectrum plot.
QT GUI Chooser
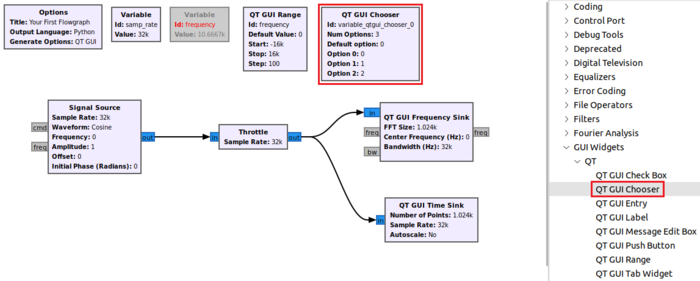
The QT GUI Chooser creates a drop-down menu of options for a variable. Navigate the block library: Core, GUI Widgets, QT, and drag and drop QT GUI Chooser into the workspace.
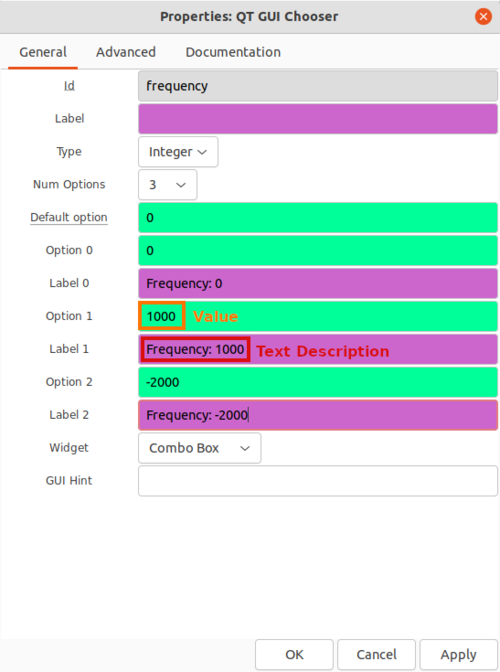
Update the default parameters for the Chooser block. The Chooser creates a list of options to select from while the flowgraph is running. In this example three frequencies are used: 0, 1000 and -2000. Update the following properties in the Chooser block:
- Id: frequency
- Default Option: 0
- Option 0: 0
- Label 0: Frequency: 0
- Option 1: 1000
- Label 1: Frequency: 1000
- Option 2: -2000
- Label 2: Frequency: -2000
The Option field is the value of the variable, Label is a text description that is displayed in the drop-down menu. The image shows an example of the Option being highlighted in orange and the Label being highlighted in red:
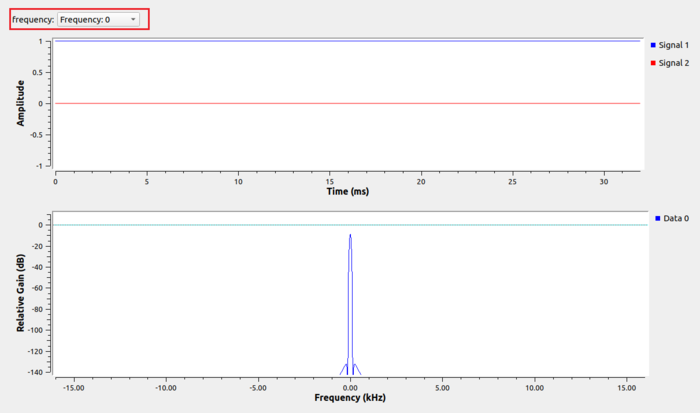
Click OK to save the parameters. Running the flowgraph will use the default value Frequency: 0 when starting. The drop-down box in the upper left hand corner shows that frequency 0 has been selected. The time domain and frequency domain both show a signal with frequency 0:
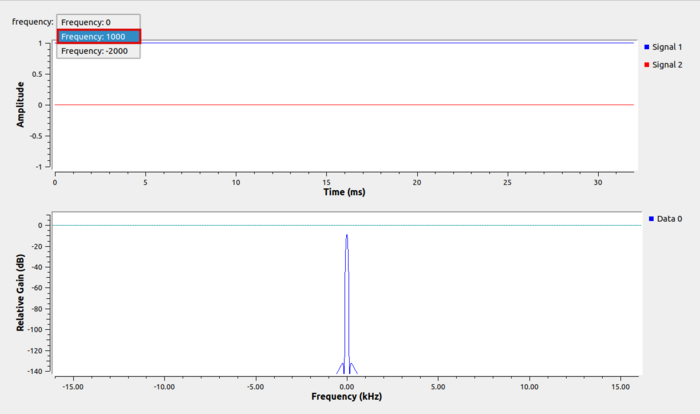
The values are selected by clicking on the drop-down menu. Click on Frequency: 1000:
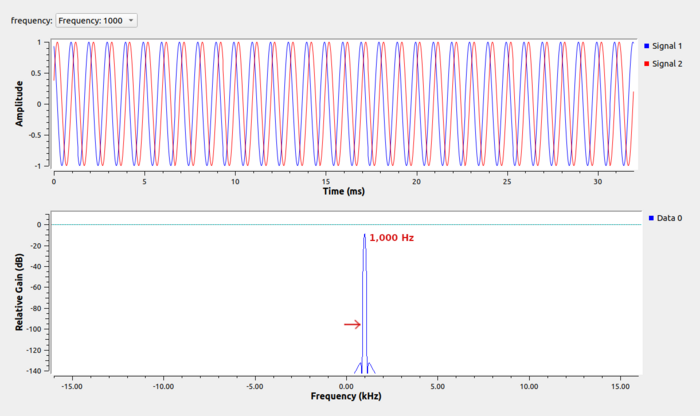
The updated frequency is seen in the frequency spectrum:
The next tutorial, Signal Data Types, discusses data types and representing complex and real signals in GNU Radio.
