Python Variables in GRC: Difference between revisions
Mattcarrick (talk | contribs) |
|||
| (69 intermediate revisions by 3 users not shown) | |||
| Line 1: | Line 1: | ||
{{ | <div style="float:right"> | ||
{{Template:BeginnerTutorials}} | |||
</div> | |||
This tutorial describes how Python data types are used in GRC and how the variables are displayed. | |||
The previous tutorial, [[Your First Flowgraph]], shows how to build a simple flowgraph. The next tutorial, [[Variables in Flowgraphs]], describes how to use and modify variables in a more sophisticated flowgraph. | |||
== Floats and Integers in GRC == | |||
GNU Radio Companion (GRC) uses Python data types to represent variables. The simplest data types describe numbers. Numbers in Python can be floating point or integers: | |||
<syntaxhighlight lang="python"> | |||
floatNumber = 3.14 | |||
integerNumber = 2 | |||
</syntaxhighlight> | |||
Integers can be converted to floating point using ''float()'', and floating point numbers can be converted to integers using ''int()'': | |||
<syntaxhighlight lang="python"> | |||
floatNumber = float(2) | |||
integerNumber = int(3.14) | |||
</syntaxhighlight> | |||
Type conversion can be done within the variable blocks: | |||
[[File:FloatToIntProperties.png|500px]] | |||
The value is displayed as an integer: | |||
[[File:FloatToIntVariable.png|200px]] | |||
GRC displays numbers differently than Python. For example, the ''samp_rate'' block is added to every new flowgraph. | |||
[[File:SampRateVariable.png|300px]] | |||
Double-click the ''samp_rate'' variable to edit the properties: | |||
[[File:SampRateProperties.png|500px]] | |||
The value of ''samp_rate'' is ''32000'' yet GRC displays the value ''32k''. GRC converts all numbers into | |||
[https://en.wikipedia.org/wiki/International_System_of_Units SI Units]. Note that GRC ''may'' display a number in a different format than it is represented in Python. | |||
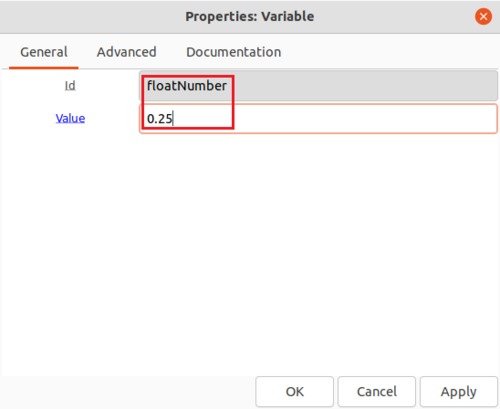
For another example, drag and drop a new variable into the workspace. Double-click to edit the properties: | |||
* Id: ''floatNumber'' | |||
* Value: ''0.25'' | |||
[[File:FloatNumberProperties.png|500px]] | |||
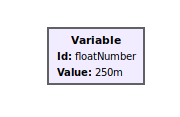
GRC now displays the value ''0.25'' as ''250m'' because it has been converted to SI units (milli-) : | |||
[[File:FloatNumberVariable.png|250px]] | |||
== Strings in GRC == | |||
Python uses both single quotes ' and double quotes " to contain strings: | Python uses both single quotes ' and double quotes " to contain strings: | ||
< | <syntaxhighlight lang="python"> | ||
< | singleQuoteString = 'string1' | ||
doubleQuoteString = "string2" | |||
</syntaxhighlight> | |||
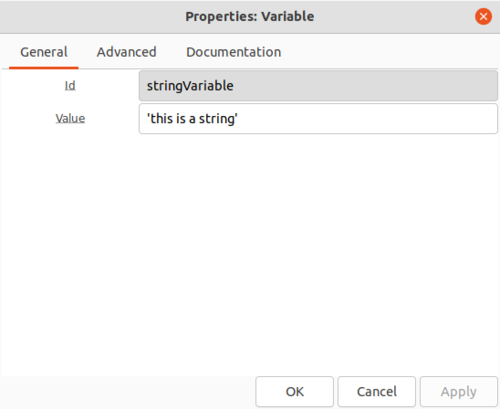
Strings can be used as variables in GRC: | |||
[[File:StringProperties.png|500px]] | |||
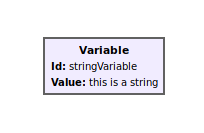
The string is displayed in GRC: | |||
[[File:StringVariable.png|250px]] | |||
== Lists and Tuples in GRC == | |||
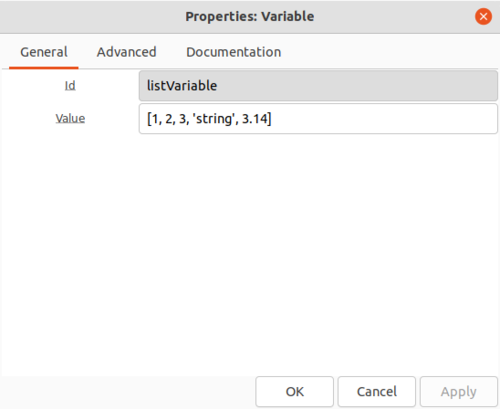
Variables in GRC can use Python lists: | |||
[[File:ListProperties.png|500px]] | |||
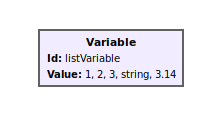
The list is displayed in GRC: | |||
[[File:ListVariable.png|300px]] | |||
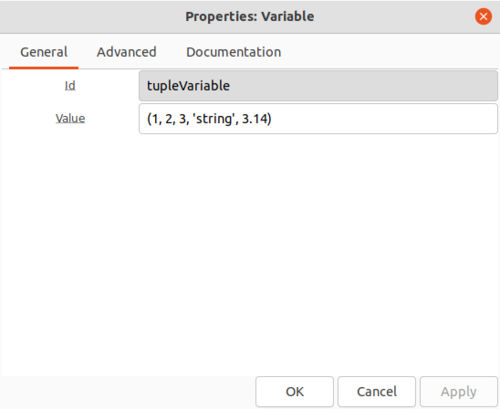
Variables in GRC can use Python tuples: | |||
[[File:TupleProperties.png|500px]] | |||
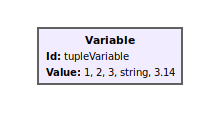
The tuple is displayed in GRC: | |||
[[File:TupleVariable.png|300px]] | |||
== List Comprehension == | |||
Each ''Variable'' is a single line in Python: | |||
''Id = Value'' | |||
[https://www.w3schools.com/python/python_lists_comprehension.asp List comprehension] can be used to write functions in a ''Variable''. For example, list comprehension is used to loop through a list, add +1 to all entries, and then multiply each entry by 2: | |||
<syntaxhighlight lang="python" line> | |||
listVariable = [0, 1, 2, 3] | |||
listComprehensionExample = [(i + 1) * 2 for i in listVariable] | |||
</syntaxhighlight> | |||
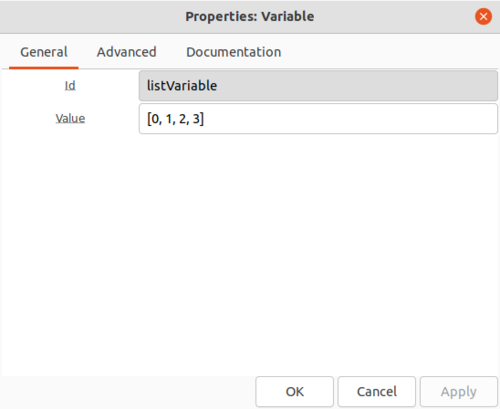
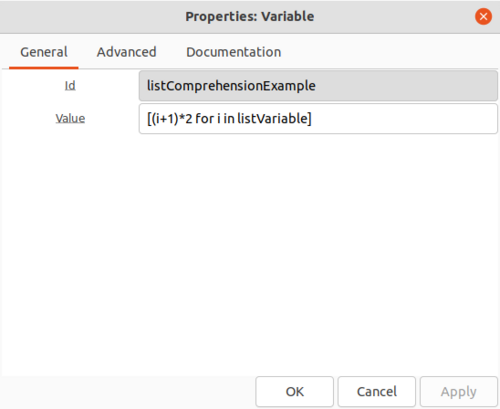
This list comprehension example is used in GNU Radio by using two variables, ''listVariable'' and ''listComprehensionExample'', and entering their associated ''values'': | |||
[[File:ListVariableProperties.png|500px]] | |||
[[File:ListComprehensionVariableProperties.png|500px]] | |||
The lists are displayed in GRC: | |||
[[File:ListComprehensionVariables.png]] | |||
== Property Colors in GNU Radio Companion == | |||
GRC uses a color scheme to represent data types when editing block properties. The properties for the ''QT GUI Frequency Sink'' block are as follows: | |||
[[File:QTGUIFrequencySinkBlock.png]] | |||
[[File:QTGUIFrequencySinkPropertyColors.png|500px]] | |||
There are a variety of colors for the ''QT GUI Frequency Sink'' properties: '''<span style="color:orange">orange</span>''', '''<span style="color:MediumSeaGreen">green</span>''' and '''<span style="color:purple">purple</span>'''. Each color corresponds to a different data type: | |||
* Floating Point: '''<span style="color:orange">orange</span>''' | |||
* Integer: '''<span style="color:MediumSeaGreen">green</span>''' | |||
* String: '''<span style="color:purple">purple</span>''' | |||
For example, the ''bandwidth'' is '''<span style="color:orange">orange</span>''' because the bandwidth can be any floating point number. The ''FFT Size'' must be an integer so it is colored in '''<span style="color:MediumSeaGreen">green</span>'''. The ''Y Label'' is a string because it contains words used to describe the vertical axis of the plot so it is colored in '''<span style="color:purple">purple</span>'''. | |||
The ''Variable'' blocks do not have a color because they can be used to represent any data type or object. | |||
The next tutorial, [[Variables in Flowgraphs]], describes how to use and modify variables in a more sophisticated flowgraph. | The next tutorial, [[Variables in Flowgraphs]], describes how to use and modify variables in a more sophisticated flowgraph. | ||
Latest revision as of 21:02, 23 October 2023
| Beginner Tutorials
Introducing GNU Radio Flowgraph Fundamentals
Creating and Modifying Python Blocks DSP Blocks
SDR Hardware |
This tutorial describes how Python data types are used in GRC and how the variables are displayed.
The previous tutorial, Your First Flowgraph, shows how to build a simple flowgraph. The next tutorial, Variables in Flowgraphs, describes how to use and modify variables in a more sophisticated flowgraph.
Floats and Integers in GRC
GNU Radio Companion (GRC) uses Python data types to represent variables. The simplest data types describe numbers. Numbers in Python can be floating point or integers:
floatNumber = 3.14
integerNumber = 2
Integers can be converted to floating point using float(), and floating point numbers can be converted to integers using int():
floatNumber = float(2)
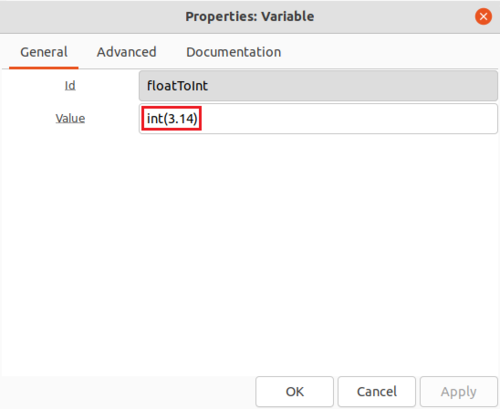
integerNumber = int(3.14)
Type conversion can be done within the variable blocks:
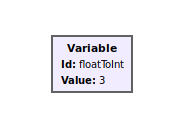
The value is displayed as an integer:
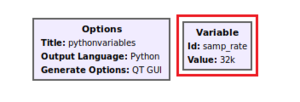
GRC displays numbers differently than Python. For example, the samp_rate block is added to every new flowgraph.
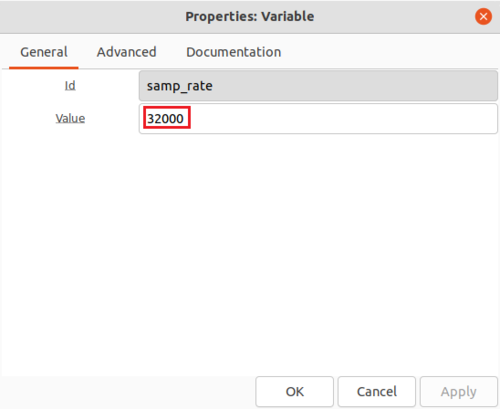
Double-click the samp_rate variable to edit the properties:
The value of samp_rate is 32000 yet GRC displays the value 32k. GRC converts all numbers into SI Units. Note that GRC may display a number in a different format than it is represented in Python.
For another example, drag and drop a new variable into the workspace. Double-click to edit the properties:
- Id: floatNumber
- Value: 0.25
GRC now displays the value 0.25 as 250m because it has been converted to SI units (milli-) :
Strings in GRC
Python uses both single quotes ' and double quotes " to contain strings:
singleQuoteString = 'string1'
doubleQuoteString = "string2"
Strings can be used as variables in GRC:
The string is displayed in GRC:
Lists and Tuples in GRC
Variables in GRC can use Python lists:
The list is displayed in GRC:
Variables in GRC can use Python tuples:
The tuple is displayed in GRC:
List Comprehension
Each Variable is a single line in Python:
Id = Value
List comprehension can be used to write functions in a Variable. For example, list comprehension is used to loop through a list, add +1 to all entries, and then multiply each entry by 2:
listVariable = [0, 1, 2, 3]
listComprehensionExample = [(i + 1) * 2 for i in listVariable]
This list comprehension example is used in GNU Radio by using two variables, listVariable and listComprehensionExample, and entering their associated values:
The lists are displayed in GRC:
Property Colors in GNU Radio Companion
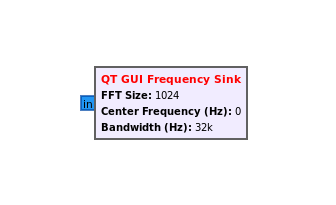
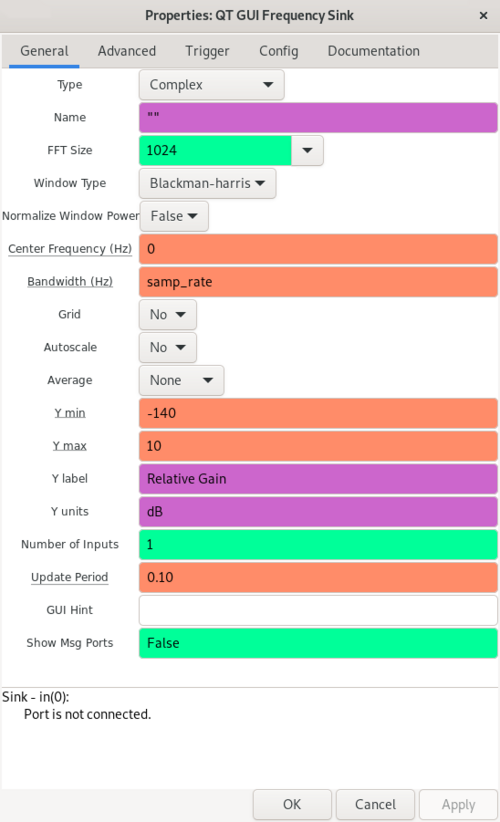
GRC uses a color scheme to represent data types when editing block properties. The properties for the QT GUI Frequency Sink block are as follows:
There are a variety of colors for the QT GUI Frequency Sink properties: orange, green and purple. Each color corresponds to a different data type:
- Floating Point: orange
- Integer: green
- String: purple
For example, the bandwidth is orange because the bandwidth can be any floating point number. The FFT Size must be an integer so it is colored in green. The Y Label is a string because it contains words used to describe the vertical axis of the plot so it is colored in purple.
The Variable blocks do not have a color because they can be used to represent any data type or object.
The next tutorial, Variables in Flowgraphs, describes how to use and modify variables in a more sophisticated flowgraph.
