Your First Flowgraph: Difference between revisions
Mattcarrick (talk | contribs) No edit summary |
(''Id'' should not end with .py, and two related clarifications) |
||
| (20 intermediate revisions by 4 users not shown) | |||
| Line 1: | Line 1: | ||
{{Template: | <div style="float:right"> | ||
{{Template:BeginnerTutorials}} | |||
</div> | |||
This tutorial describes how to create and run your first flowgraph in GNU Radio. | |||
This tutorial | This guide assumes GNU Radio is installed. The GNU Radio installation structures are here: [[InstallingGR|Installing GNU Radio]]. The next tutorial, [[Python Variables in GRC]], describes how Python data types are used in GNU Radio Companion (GRC). | ||
== Starting GNU Radio Companion == | |||
The GNU Radio Companion (GRC) is a visual editor for creating and running flowgraphs. GRC uses ''.grc'' files which are then translated into Python ''.py'' flowgraphs. | |||
== Starting | |||
The | |||
Open a terminal by pressing ''CTRL'' + ''ALT'' + ''T'' or by right-clicking on the desktop and selecting ''Open in Terminal'': | Open a terminal by pressing ''CTRL'' + ''ALT'' + ''T'' or by right-clicking on the desktop and selecting ''Open in Terminal'': | ||
| Line 12: | Line 13: | ||
[[File:OpenTerminal.png|500px]] | [[File:OpenTerminal.png|500px]] | ||
Type in the terminal: | |||
<pre>$ gnuradio-companion &</pre> | <pre>$ gnuradio-companion &</pre> | ||
The GRC window | The GRC window opens: | ||
[[File:NewGRCFlowgraph.png|500px]] | [[File:NewGRCFlowgraph.png|500px]] | ||
Double click the ''Options'' block | Double click the ''Options'' block and name the flowgraph by editing the ''Id'' and ''Title'': | ||
[[File:NameYourFlowgraph.png|500px]] | [[File:NameYourFlowgraph.png|500px]] | ||
The ''Id'' | The ''Id'' is the filename of the Python flowgraph. Name it ''sineWaveFlowgraph''. The ''Title'' is a description of the flowgraph. Click ''OK'' to save the changes. | ||
Click ''File : Save'' to save | Click ''File : Save'' to save the GRC Flowgraph. | ||
[[File:GRCClickSave.png|500px]] | [[File:GRCClickSave.png|500px]] | ||
Enter ''sineWaveGRC.grc'' as the name for the ''.grc'' file to distinguish it from the Id. | |||
Enter | |||
[[File:EnterGRCName.png|500px]] | [[File:EnterGRCName.png|500px]] | ||
The GRC file is named and saved. | |||
== Adding Blocks == | == Adding Blocks == | ||
Blocks are added to create the first flowgraph. GNU Radio comes with a library of signal processing blocks. The blocks can be browsed using the arrows on the right. Blocks may also be searched for using ''CTRL + F'' or by selecting the magnifying glass (highlighted in <span style="color:red">red</span>): | |||
[[File:SearchBlockLibrary.png|500px]] | [[File:SearchBlockLibrary.png|500px]] | ||
| Line 47: | Line 48: | ||
[[File:SearchSignalSourceBlock.png|250px]] | [[File:SearchSignalSourceBlock.png|250px]] | ||
Now search for ''Throttle'', ''QT GUI Frequency Sink'' and ''QT GUI Time Sink''. Drag and drop each of the blocks into the workspace | Now search for ''Throttle'', ''QT GUI Frequency Sink'' and ''QT GUI Time Sink''. Drag and drop each of the blocks into the workspace. The flowgraph should like the following: | ||
[[File:UnconnectedFlowgraph.png|500px]] | [[File:UnconnectedFlowgraph.png|500px]] | ||
The ''Signal Source'' block will create a complex sinusoid, ''QT GUI Frequency Sink'' will display the magnitude of the frequency spectrum | The ''Signal Source'' block will create a complex sinusoid, ''QT GUI Frequency Sink'' will display the magnitude of the frequency spectrum and ''QT GUI Time Sink'' will display the time domain. The ''Throttle'' block is used for flow control in the absence of radio hardware. | ||
The blocks need to be connected. First click the output of ''Signal Source'' (highlighted in <span style="color:red">red</span>) and then click the input to the ''Throttle'' (highlighted in <span style="color:orange">orange</span>). | The blocks need to be connected. First click the output of ''Signal Source'' (highlighted in '''<span style="color:red">red</span>''') and then click the input to the ''Throttle'' (highlighted in '''<span style="color:orange">orange</span>'''). | ||
[[File:MakeFirstConnection.png|500px]] | [[File:MakeFirstConnection.png|500px]] | ||
The ''Signal Source'' block text changed from '''<span style="color:red">red</span>''' to '''black'''. The '''<span style="color:red">red</span>''' text means a block still has an input or output that needs to be connected before the flowgraph can be run. Connect the throttle output to the frequency sink and time sink: | |||
[[File:ConnectedFlowgraph.png|500px]] | [[File:ConnectedFlowgraph.png|500px]] | ||
| Line 63: | Line 64: | ||
== Running The Flowgraph == | == Running The Flowgraph == | ||
Press the ''Play'' button (highlighted in red) to run the flowgraph: | Press the ''Play'' button (highlighted in '''<span style="color:red">red</span>''') to run the flowgraph: | ||
[[File:RunFlowgraphButton.png|250px]] | [[File:RunFlowgraphButton.png|250px]] | ||
A new window | A new window displays the signal in the time domain and frequency domain: | ||
[[File:FrequencySinkTimeSink.png|500px]] | [[File:FrequencySinkTimeSink.png|500px]] | ||
Success! | Success! The flowgraph is running. | ||
Open the file browser. There are two files. The first file is ''sineWaveGRC.grc'', containing the information for the display of the flowgraph in GRC. The second file is ''sineWaveFlowgraph.py'', containing the actual Python flowgraph code. The ''Id'' in the Options block determines the name of the ''.py'' file. | |||
[[File:GRCandPy.png|250px]] | [[File:GRCandPy.png|250px]] | ||
Continue onto the next tutorial, [[Variables in | Continue onto the next tutorial, [[Python Variables in GRC]], which describes how Python data types are used in GRC. | ||
Latest revision as of 02:42, 27 February 2023
| Beginner Tutorials
Introducing GNU Radio Flowgraph Fundamentals
Creating and Modifying Python Blocks DSP Blocks
SDR Hardware |
This tutorial describes how to create and run your first flowgraph in GNU Radio.
This guide assumes GNU Radio is installed. The GNU Radio installation structures are here: Installing GNU Radio. The next tutorial, Python Variables in GRC, describes how Python data types are used in GNU Radio Companion (GRC).
Starting GNU Radio Companion
The GNU Radio Companion (GRC) is a visual editor for creating and running flowgraphs. GRC uses .grc files which are then translated into Python .py flowgraphs.
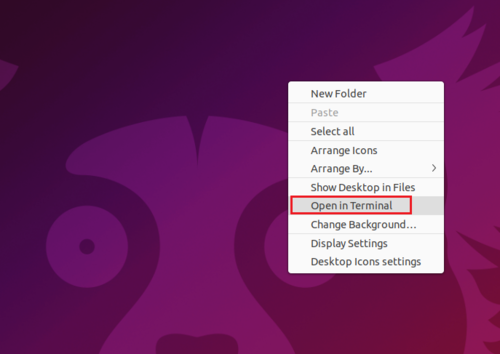
Open a terminal by pressing CTRL + ALT + T or by right-clicking on the desktop and selecting Open in Terminal:
Type in the terminal:
$ gnuradio-companion &
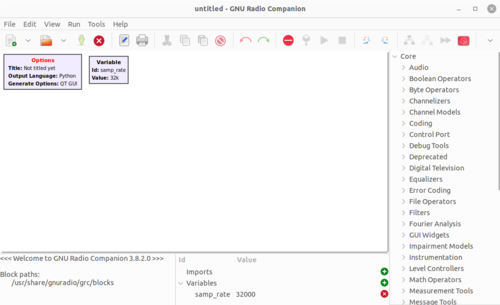
The GRC window opens:
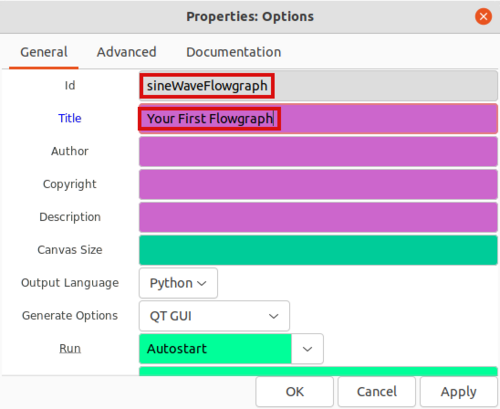
Double click the Options block and name the flowgraph by editing the Id and Title:
The Id is the filename of the Python flowgraph. Name it sineWaveFlowgraph. The Title is a description of the flowgraph. Click OK to save the changes.
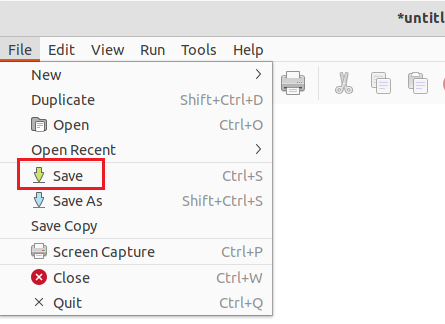
Click File : Save to save the GRC Flowgraph.
Enter sineWaveGRC.grc as the name for the .grc file to distinguish it from the Id.
The GRC file is named and saved.
Adding Blocks
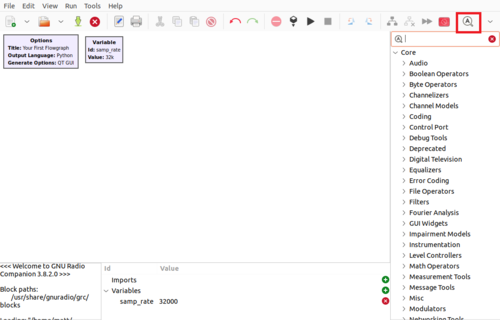
Blocks are added to create the first flowgraph. GNU Radio comes with a library of signal processing blocks. The blocks can be browsed using the arrows on the right. Blocks may also be searched for using CTRL + F or by selecting the magnifying glass (highlighted in red):
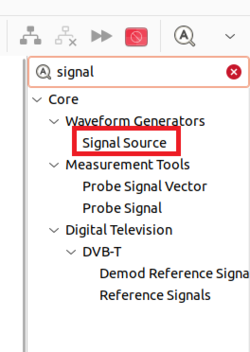
Search for the Signal Source block and then drag and drop it into the GRC workspace:
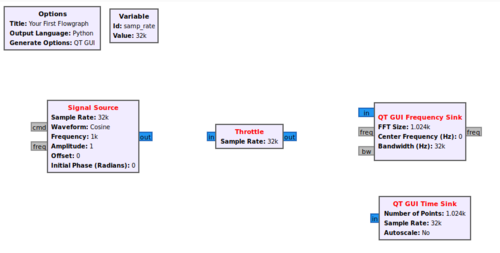
Now search for Throttle, QT GUI Frequency Sink and QT GUI Time Sink. Drag and drop each of the blocks into the workspace. The flowgraph should like the following:
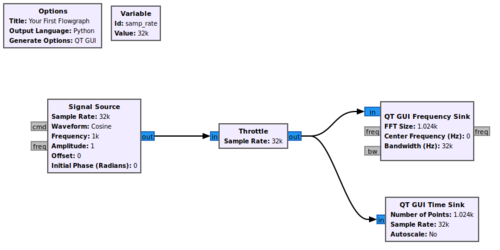
The Signal Source block will create a complex sinusoid, QT GUI Frequency Sink will display the magnitude of the frequency spectrum and QT GUI Time Sink will display the time domain. The Throttle block is used for flow control in the absence of radio hardware.
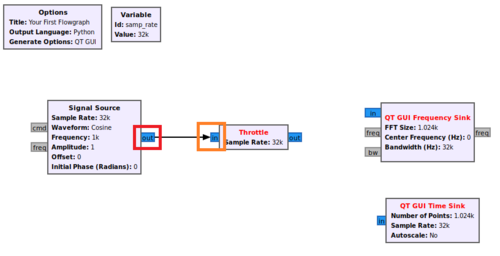
The blocks need to be connected. First click the output of Signal Source (highlighted in red) and then click the input to the Throttle (highlighted in orange).
The Signal Source block text changed from red to black. The red text means a block still has an input or output that needs to be connected before the flowgraph can be run. Connect the throttle output to the frequency sink and time sink:
Running The Flowgraph
Press the Play button (highlighted in red) to run the flowgraph:
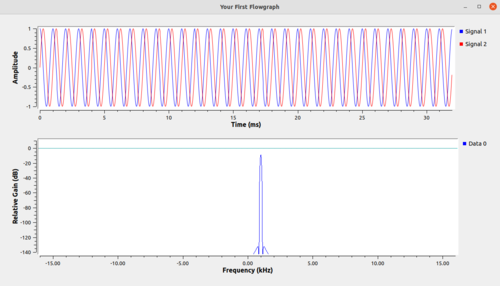
A new window displays the signal in the time domain and frequency domain:
Success! The flowgraph is running.
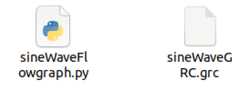
Open the file browser. There are two files. The first file is sineWaveGRC.grc, containing the information for the display of the flowgraph in GRC. The second file is sineWaveFlowgraph.py, containing the actual Python flowgraph code. The Id in the Options block determines the name of the .py file.
Continue onto the next tutorial, Python Variables in GRC, which describes how Python data types are used in GRC.
