Variables in Flowgraphs: Difference between revisions
Mattcarrick (talk | contribs) No edit summary |
(Try to clarify the role of GRC in creating Python code since most people use GRC instead of writing Python flowgraphs from scratch) |
||
| (30 intermediate revisions by 3 users not shown) | |||
| Line 1: | Line 1: | ||
<div style="float:right"> | |||
{{Template:BeginnerTutorials}} | |||
</div> | |||
This tutorial describes how to use variables in a flowgraph. The flowgraph from a previous tutorial ([[Your First Flowgraph]]) is used as a starting point for this tutorial. Please complete the [[Your First Flowgraph]] tutorial beforehand. | |||
The previous tutorial, [[Python Variables in GRC]], describes how GRC uses Python data types and how values are displayed in ''Variable'' blocks. The next tutorial, [[Runtime Updating Variables]], demonstrates how variables are updated while a flowgraph is running. | |||
== | ==Basic Variables== | ||
GRC allows a user to interact with GNURadio flowgraphs, either ones they create from scratch interactively, or ones that are read from a ''.grc'' file. | |||
When the GRC user uses the ''play'' button to execute a flowgraph, GRC creates a ''.py'' Python file that contains the flowgraph's code. | |||
Python code can have variables, and a GNURadio flowgraph can have variables created by the ''Variable'' block. | |||
Every new flowgraph starts with the ''samp_rate'' variable: | Every new flowgraph starts with the ''samp_rate'' variable: | ||
| Line 11: | Line 19: | ||
GNURadio blocks are implemented as functions | GNURadio blocks are implemented as functions. GNU Radio blocks take parameters which modify the behavior. All of the blocks in the flowgraph above use ''samp_rate'' as a parameter. Create a new variable block by dragging and dropping it from the block library on the right: | ||
[[File:NewVariableBlock.png|800px]] | [[File:NewVariableBlock.png|800px]] | ||
Double-click the ''variable_0'' block to view and modify | Double-click the ''variable_0'' block to view and modify the parameters. | ||
[[File:VariableProperties.png|500px]] | [[File:VariableProperties.png|500px]] | ||
The ''Id'' field is the name of the variable. The variable | The ''Id'' field is the name of the variable. The variable will be the frequency of the ''Signal Source'' block. Edit the name to ''frequency''. Now edit the value to ''4000''. | ||
[[File:FrequencyVariable.png|500px]] | [[File:FrequencyVariable.png|500px]] | ||
| Line 27: | Line 35: | ||
Click ''OK'' to save. | Click ''OK'' to save. | ||
Double-click the ''Signal Source'' block to modify | Double-click the ''Signal Source'' block to modify the parameters: | ||
[[File:SignalSourceProperties.png|500px]] | [[File:SignalSourceProperties.png|500px]] | ||
The ''Frequency'' is set to ''1000''. Enter ''frequency'' into the Frequency field to use the variable: | |||
[[File:SignalSourceFrequency.png|500px]] | [[File:SignalSourceFrequency.png|500px]] | ||
Click ''OK'' to save the properties. | Click ''OK'' to save the properties. The ''frequency'' variable and the value within the ''Signal Source'' block are updated: | ||
[[File:FlowgraphWithFrequencyVariable.png|600px]] | |||
Run the flowgraph: | |||
[[File:FlowgraphNewFrequencyOutput.png|800px]] | |||
The peak of the frequency response has moved to ''4,000'' due to the variable change. | |||
Variables | ==Dependent Variables== | ||
The ''Id'' and ''Value'' fields are converted into a line of Python in the following manner: | Variables can be dependent on one another. The ''Id'' and ''Value'' fields are converted into a line of Python in the following manner: | ||
<pre>Id = Value</pre> | <pre>Id = Value</pre> | ||
The ''frequency'' variable was modified to accept the value ''4000'', which is the same as a line of Python code: | |||
<pre>frequency = 4000</pre> | <pre>frequency = 4000</pre> | ||
The ''frequency'' variable can also be dependent on another variable. Edit ''frequency'' | The ''frequency'' variable can also be dependent on another variable. Edit ''frequency'' to enter the value ''samp_rate/3'', which for ''samp_rate = 32000'' will be a frequency of ''10,667''. | ||
[[File:ExampleDependentVariable.png|500px]] | [[File:ExampleDependentVariable.png|500px]] | ||
The change | The change is displayed in the flowgraph: | ||
[[File:UpdatedFrequencyFlowgraph.png|600px]] | |||
Running the flowgraph shows the frequency is updated: | |||
[[File:FrequencySinkUpdatedFrequency.png|800px]] | |||
[[ | The next tutorial, [[Runtime_Updating_Variables|Runtime Updating Variables]], demonstrates how variables are updated while a flowgraph is running. | ||
Latest revision as of 15:21, 27 July 2022
| Beginner Tutorials
Introducing GNU Radio Flowgraph Fundamentals
Creating and Modifying Python Blocks DSP Blocks
SDR Hardware |
This tutorial describes how to use variables in a flowgraph. The flowgraph from a previous tutorial (Your First Flowgraph) is used as a starting point for this tutorial. Please complete the Your First Flowgraph tutorial beforehand.
The previous tutorial, Python Variables in GRC, describes how GRC uses Python data types and how values are displayed in Variable blocks. The next tutorial, Runtime Updating Variables, demonstrates how variables are updated while a flowgraph is running.
Basic Variables
GRC allows a user to interact with GNURadio flowgraphs, either ones they create from scratch interactively, or ones that are read from a .grc file.
When the GRC user uses the play button to execute a flowgraph, GRC creates a .py Python file that contains the flowgraph's code.
Python code can have variables, and a GNURadio flowgraph can have variables created by the Variable block.
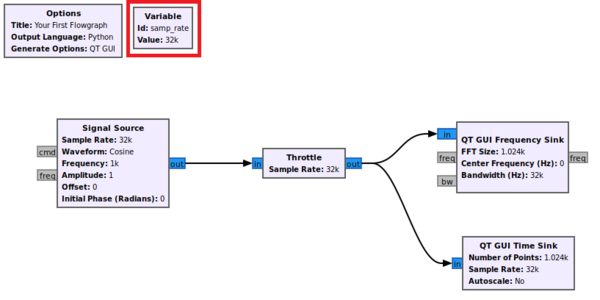
Every new flowgraph starts with the samp_rate variable:
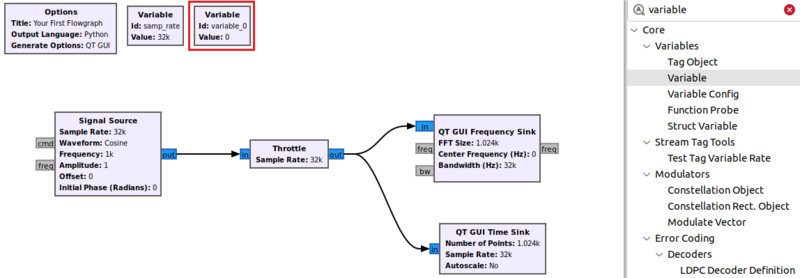
GNURadio blocks are implemented as functions. GNU Radio blocks take parameters which modify the behavior. All of the blocks in the flowgraph above use samp_rate as a parameter. Create a new variable block by dragging and dropping it from the block library on the right:
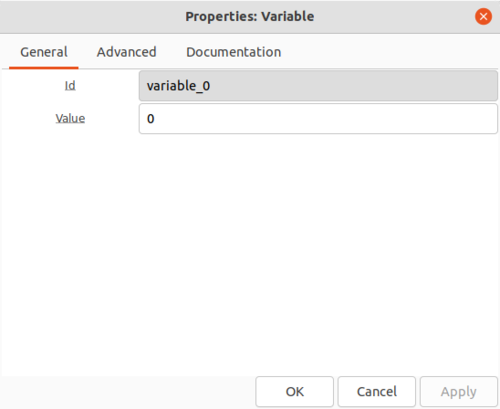
Double-click the variable_0 block to view and modify the parameters.
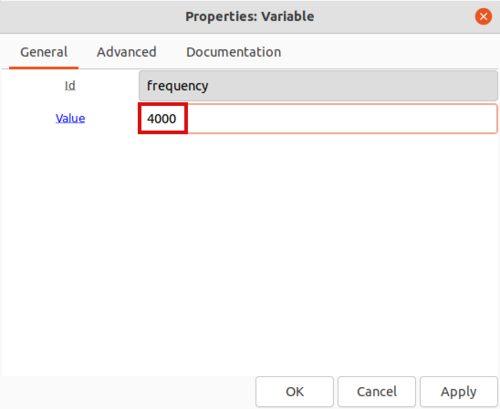
The Id field is the name of the variable. The variable will be the frequency of the Signal Source block. Edit the name to frequency. Now edit the value to 4000.
Click OK to save.
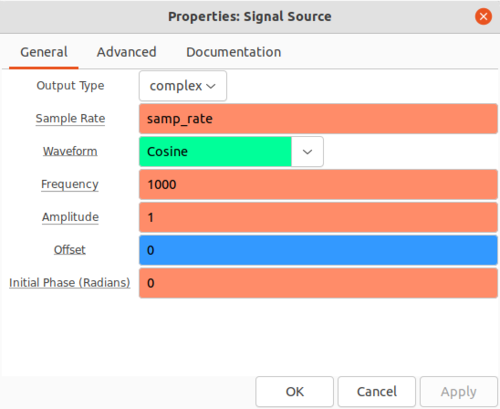
Double-click the Signal Source block to modify the parameters:
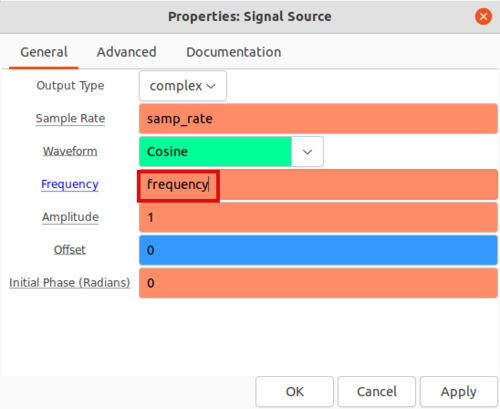
The Frequency is set to 1000. Enter frequency into the Frequency field to use the variable:
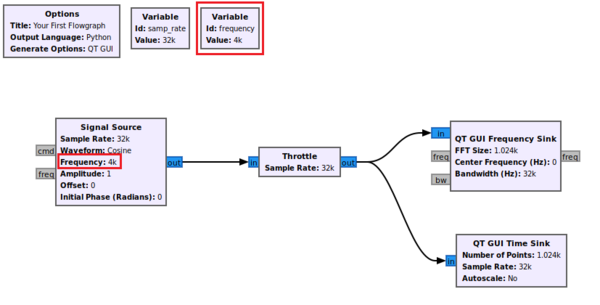
Click OK to save the properties. The frequency variable and the value within the Signal Source block are updated:
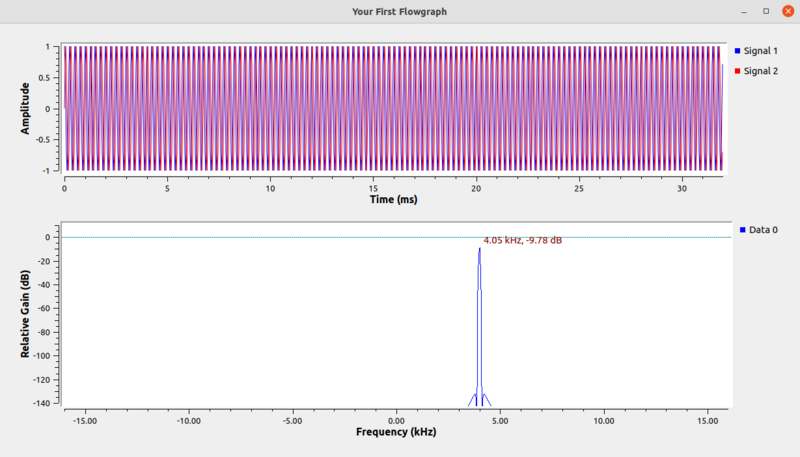
Run the flowgraph:
The peak of the frequency response has moved to 4,000 due to the variable change.
Dependent Variables
Variables can be dependent on one another. The Id and Value fields are converted into a line of Python in the following manner:
Id = Value
The frequency variable was modified to accept the value 4000, which is the same as a line of Python code:
frequency = 4000
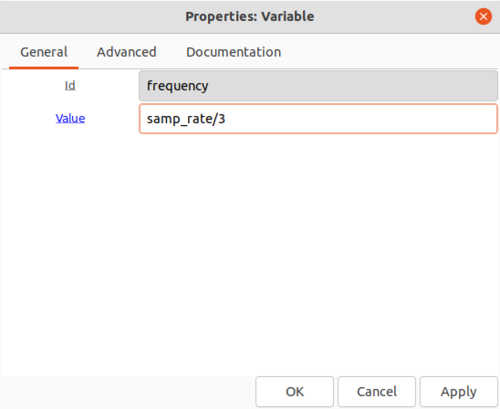
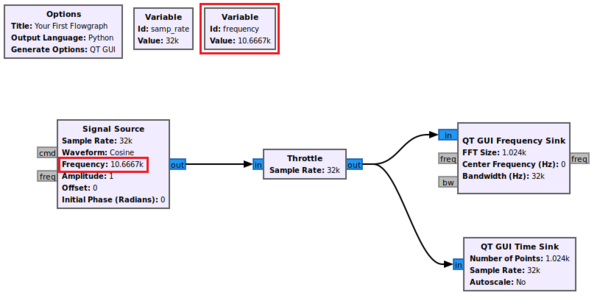
The frequency variable can also be dependent on another variable. Edit frequency to enter the value samp_rate/3, which for samp_rate = 32000 will be a frequency of 10,667.
The change is displayed in the flowgraph:
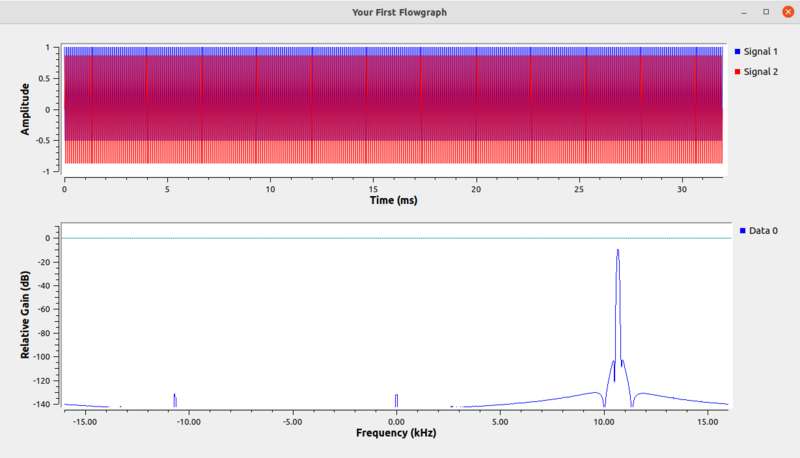
Running the flowgraph shows the frequency is updated:
The next tutorial, Runtime Updating Variables, demonstrates how variables are updated while a flowgraph is running.
