Streams and Vectors: Difference between revisions
Mattcarrick (talk | contribs) No edit summary |
m (fixed tense) |
||
| (70 intermediate revisions by 2 users not shown) | |||
| Line 1: | Line 1: | ||
This tutorial | <div style="float:right"> | ||
{{Template:BeginnerTutorials}} | |||
</div> | |||
This tutorial describes the differences between a ''Stream'' and a ''Vector''. | |||
The previous tutorial, [[Packing_Bits|Packing Bits]], describes how to pack a stream of bits into the ''byte'' or ''char'' data type, and then unpack them back into a stream of bits. The next tutorial, [[Hier_Blocks_and_Parameters|Hier Blocks and Parameters]], demonstrates how to create a ''Hierarchical Block'' and using ''Parameters''. | |||
== Streams == | == Streams == | ||
Blocks in GNU Radio can be connected using either ''streams'' or ''vectors''. A ''stream'' carries 1 sample for each time instance. A ''stream'' produces serialized data. A ''stream'' must have a data type, such as ''Float 32'' or ''Byte''. | |||
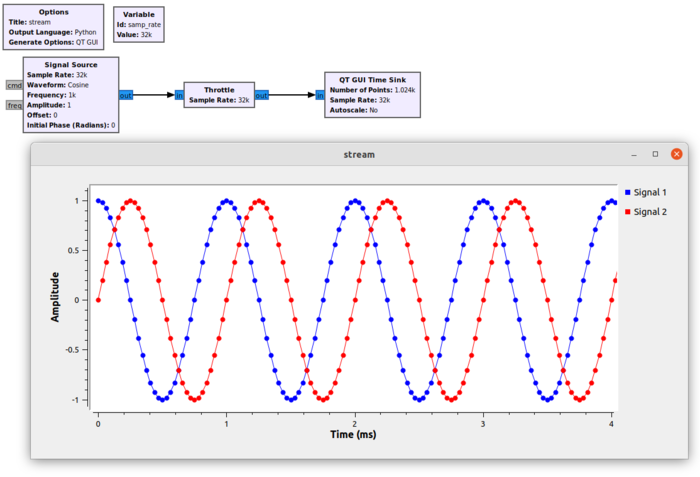
The ''Signal Source'' block produces a ''Complex Float 32'' stream. The output of the block at each time instance contains 1 complex sample: | |||
[[File:SignalSourceStreamExample.png|700px]] | |||
The figure shows there is a single complex sample at each time instance. | |||
== Vectors == | == Vectors == | ||
Vectors are | ''Vectors'' carry multiple samples per time instance. ''Vectors'' represent data in parallel. A ''stream'' represents a scalar at each time instance. A ''vector'' represents an array at each time instance. | ||
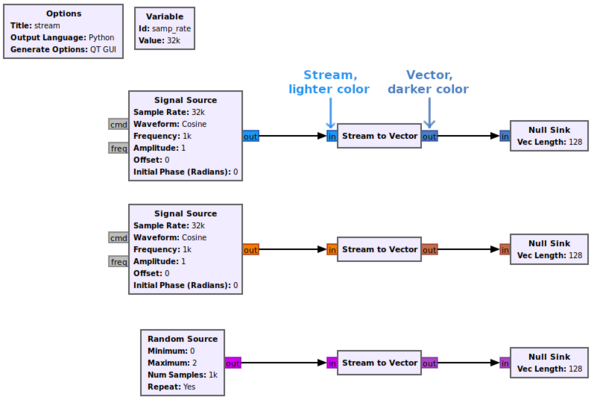
GRC uses lighter colors to represent ''streams'' and darker colors to represent ''vector'' outputs: | |||
[[File:StreamVectorDarkerColors.png|600px]] | |||
== Streams to Vector Flowgraph Example == | |||
The following example describes how to convert a stream to a vector and back to a stream. Two complex sinusoid streams are converted to a 2-element vector, displayed, and then converted back to their two independent streams. | |||
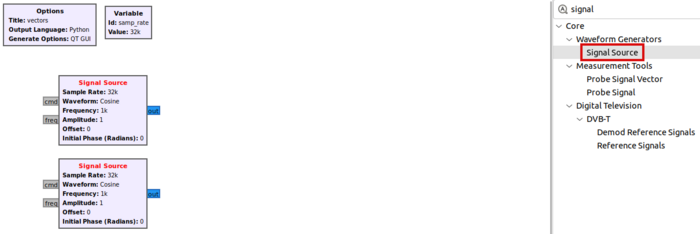
Add two ''Signal Source'' blocks to the workspace: | |||
[[File:TwoSignalSourceBlocks.png|700px]] | |||
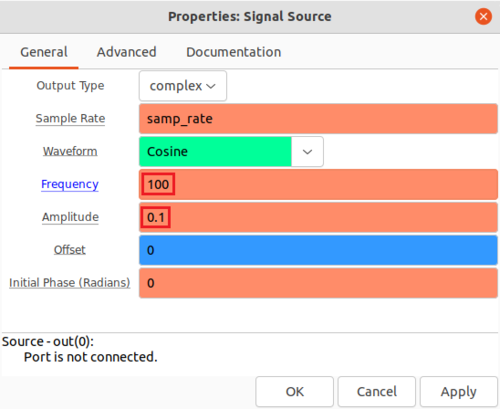
Edit the parameters of the second ''Signal Source'' to have a frequency of 100 and amplitude of 0.1 to distinguish it visually from the first ''Signal Source'': | |||
[[File:ChangeFrequencyAmplitudeSignalSource.png|500px]] | |||
Click ''OK'' to accept the parameters. | |||
Search for the ''Streams to Vector'' block, drag it into the workspace and connect it to the ''Signal Source'' blocks: | |||
[[File:ConnectStreamsToVector.png|700px]] | |||
The ''Streams to Vector'' block acts as an interleaver. The ''Streams to Vector'' block takes a sample from the ''in0'' port and places it into the first element in the output ''vector''. The ''Streams to Vector'' block takes a sample from the ''in1'' port and places it into the second element in the output ''vector''. The ''Streams to Vector'' block combines two serial ''stream'' inputs into a two-dimensional ''vector'' output. | |||
Search for the ''Vector to Stream'' block and add three ''QT GUI Time Sink'' blocks to the flowgraph: | |||
[[File:InterleavedSignalSourceWithTimeSinks.png|700px]] | |||
The ''Vector to Stream'' block will serialize the vector into a stream. The samples at the output of ''Vector to Stream'' will be interleaved. | |||
Edit the titles for the three ''QT GUI Time Sink'' blocks so the can be distinguished from one another. First, edit the block connected to the ''Signal Source'' with frequency 1000 and amplitude 1 to have the title ''Signal Source A'': | |||
[[File:TimeSinkAProperty.png|500px]] | |||
[[File:SignalSourceATimeSink.png|700px]] | |||
Now edit the ''QT GUI Time Sink'' connected to the second ''Signal Source'' with frequency 100 and Amplitude 0.1 to have the title ''Signal Source B'': | |||
[[File:TimeSinkBProperty.png|500px]] | |||
[[File:SignalSourceBTimeSink.png|700px]] | |||
Finally, edit the ''QT GUI Time Sink'' connected to the ''Vector to Stream'' block to have the title ''Interleaved Signal Sources'': | |||
[[File:TimeSinkInterleavedProperty.png]] | |||
[[File:InterleavedSignalSourceTimeSink.png|700px]] | |||
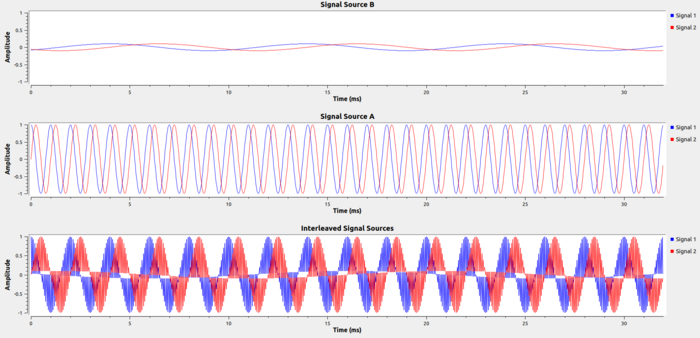
Running the flowgraph displays three time sinks, ''Signal Source A'', ''Signal Source B'', and ''Interleaved Signal Sources''. The ''Interleaved Signal Sources'' time sink displays interleaved samples from ''Signal Source A'' and ''Signal Source B'': | |||
[[File:TimeSinkSignalSources.png|700px]] | |||
== Vector to Streams Flowgraph Example == | |||
The following example deinterleaves (or serializes) the vectorized data, converting it back into two streams. | |||
Search for the ''Vector to Streams'' block, add it to the workspace, and connect it to the ''Streams to Vector'' block: | |||
[[File:AddVectorToStreamsBlock.png|700px]] | |||
The ''Vector to Streams'' block deserializes vector samples and converts them into streams, performing the inverse operation to the ''Streams to Vector'' block. | |||
Right-click and delete the arrows connecting the two ''Signal Source'' blocks to the ''QT GUI Time Sink'' blocks: | |||
[[File:DeleteTimeSinks.png|700px]] | |||
Move and reconnect the two ''QT GUI Time Sink'' blocks to the ''Vector to Streams'' outputs: | |||
[[File:ReconnectedTimeSinks.png|700px]] | |||
Run the flowgraph. The vectorized samples have been separated back into two streams: | |||
[[File:DeserializedTimeSink.png|700px]] | |||
The next tutorial, [[Hier_Blocks_and_Parameters|Hier Blocks and Parameters]], demonstrates how to create a ''Hierarchical Block'' and use ''Parameters''. | |||
Latest revision as of 10:18, 17 January 2023
| Beginner Tutorials
Introducing GNU Radio Flowgraph Fundamentals
Creating and Modifying Python Blocks DSP Blocks
SDR Hardware |
This tutorial describes the differences between a Stream and a Vector.
The previous tutorial, Packing Bits, describes how to pack a stream of bits into the byte or char data type, and then unpack them back into a stream of bits. The next tutorial, Hier Blocks and Parameters, demonstrates how to create a Hierarchical Block and using Parameters.
Streams
Blocks in GNU Radio can be connected using either streams or vectors. A stream carries 1 sample for each time instance. A stream produces serialized data. A stream must have a data type, such as Float 32 or Byte.
The Signal Source block produces a Complex Float 32 stream. The output of the block at each time instance contains 1 complex sample:
The figure shows there is a single complex sample at each time instance.
Vectors
Vectors carry multiple samples per time instance. Vectors represent data in parallel. A stream represents a scalar at each time instance. A vector represents an array at each time instance.
GRC uses lighter colors to represent streams and darker colors to represent vector outputs:
Streams to Vector Flowgraph Example
The following example describes how to convert a stream to a vector and back to a stream. Two complex sinusoid streams are converted to a 2-element vector, displayed, and then converted back to their two independent streams.
Add two Signal Source blocks to the workspace:
Edit the parameters of the second Signal Source to have a frequency of 100 and amplitude of 0.1 to distinguish it visually from the first Signal Source:
Click OK to accept the parameters.
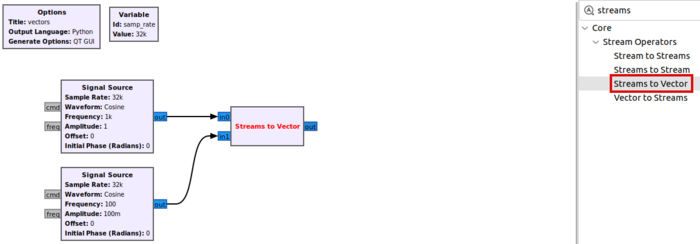
Search for the Streams to Vector block, drag it into the workspace and connect it to the Signal Source blocks:
The Streams to Vector block acts as an interleaver. The Streams to Vector block takes a sample from the in0 port and places it into the first element in the output vector. The Streams to Vector block takes a sample from the in1 port and places it into the second element in the output vector. The Streams to Vector block combines two serial stream inputs into a two-dimensional vector output.
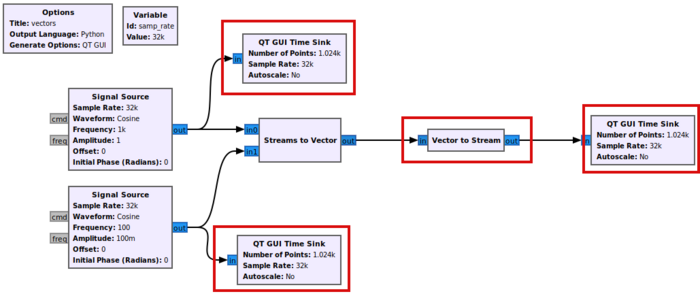
Search for the Vector to Stream block and add three QT GUI Time Sink blocks to the flowgraph:
The Vector to Stream block will serialize the vector into a stream. The samples at the output of Vector to Stream will be interleaved.
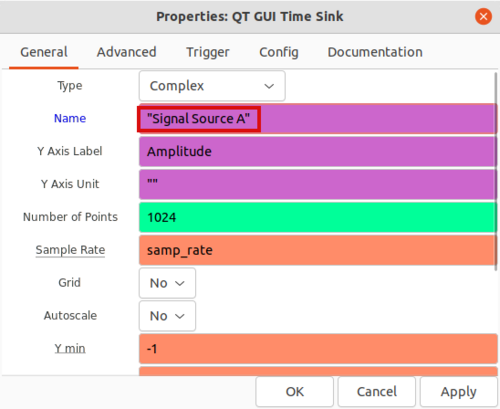
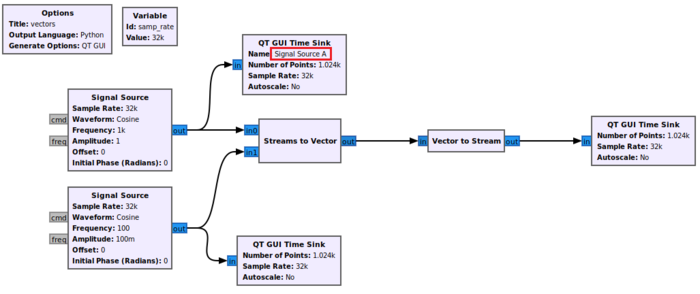
Edit the titles for the three QT GUI Time Sink blocks so the can be distinguished from one another. First, edit the block connected to the Signal Source with frequency 1000 and amplitude 1 to have the title Signal Source A:
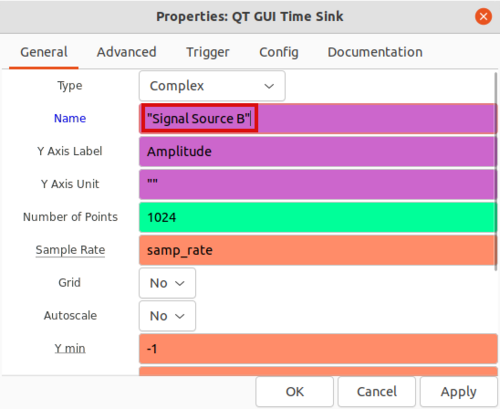
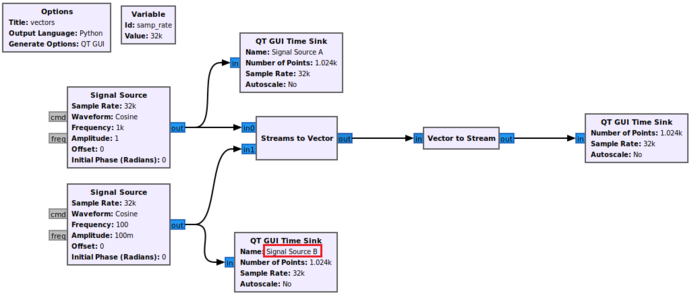
Now edit the QT GUI Time Sink connected to the second Signal Source with frequency 100 and Amplitude 0.1 to have the title Signal Source B:
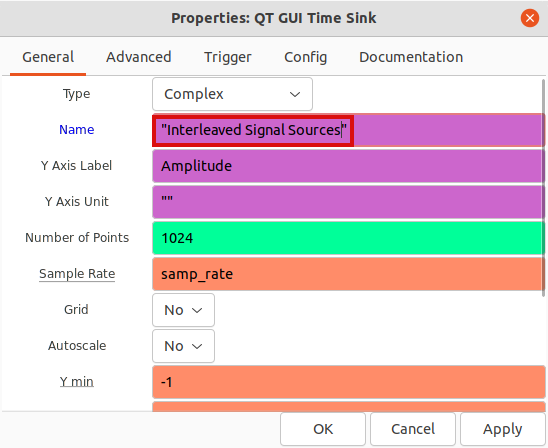
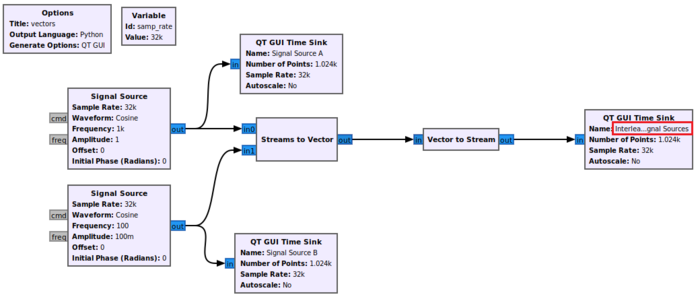
Finally, edit the QT GUI Time Sink connected to the Vector to Stream block to have the title Interleaved Signal Sources:
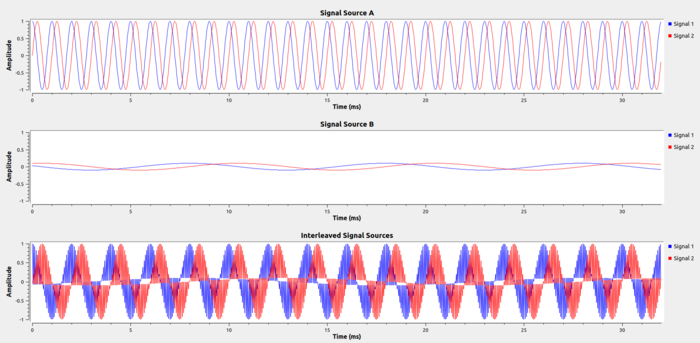
Running the flowgraph displays three time sinks, Signal Source A, Signal Source B, and Interleaved Signal Sources. The Interleaved Signal Sources time sink displays interleaved samples from Signal Source A and Signal Source B:
Vector to Streams Flowgraph Example
The following example deinterleaves (or serializes) the vectorized data, converting it back into two streams.
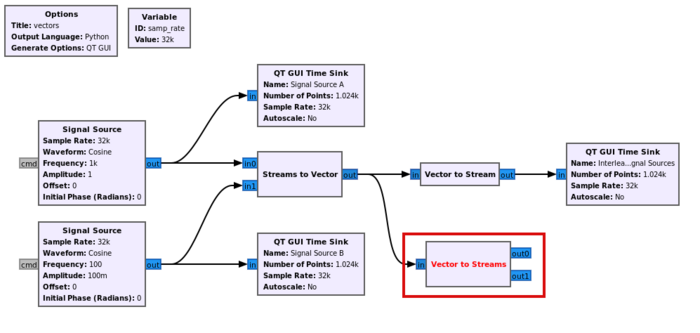
Search for the Vector to Streams block, add it to the workspace, and connect it to the Streams to Vector block:
The Vector to Streams block deserializes vector samples and converts them into streams, performing the inverse operation to the Streams to Vector block.
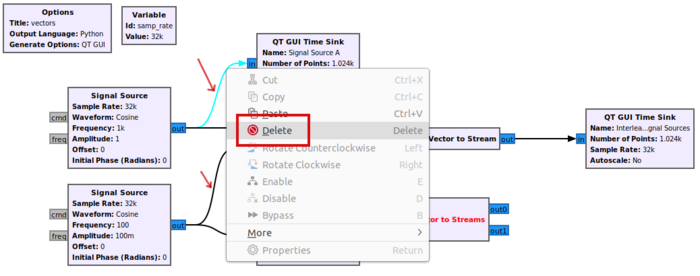
Right-click and delete the arrows connecting the two Signal Source blocks to the QT GUI Time Sink blocks:
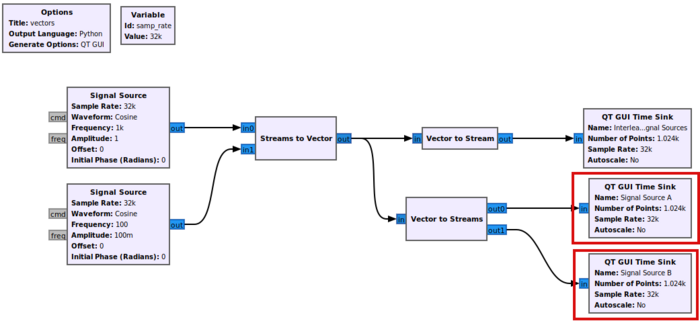
Move and reconnect the two QT GUI Time Sink blocks to the Vector to Streams outputs:
Run the flowgraph. The vectorized samples have been separated back into two streams:
The next tutorial, Hier Blocks and Parameters, demonstrates how to create a Hierarchical Block and use Parameters.
