Low Pass Filter Example
| Beginner Tutorials
Introducing GNU Radio Flowgraph Fundamentals
Creating and Modifying Python Blocks DSP Blocks
SDR Hardware |
This tutorial describes how to use a low-pass filter in GNU Radio.
The previous tutorial, Python Block Tags, describes how to read and write tags in a Python block. The next tutorial, Designing Filter Taps, describes how to design a set of low-pass filter taps and apply them against a signal.
Creating the Flowgraph
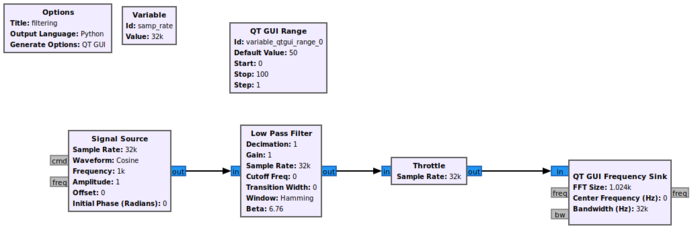
Begin by adding the following blocks to the GRC work space:
- Signal Source
- Low Pass Filter
- Throttle
- QT GUI Frequency Sink
- QT GUI Range
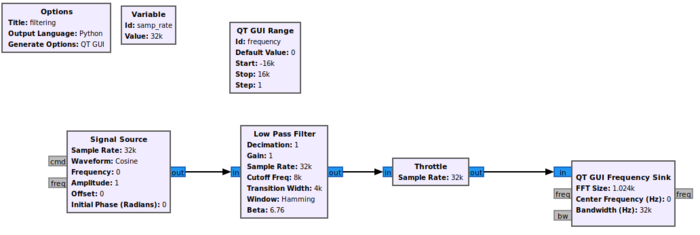
Connect the blocks in the following manner:
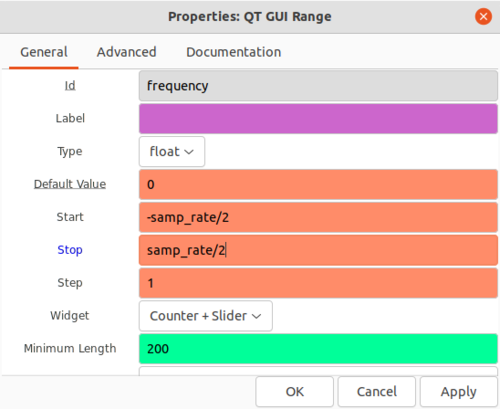
The QT GUI Range block is used to control the frequency of the Signal Source block. Double-click the QT GUI Range block and edit the properties:
- Id: frequency
- Default Value: 0
- Start: -samp_rate/2
- Stop: samp_rate/2
Click OK to save.
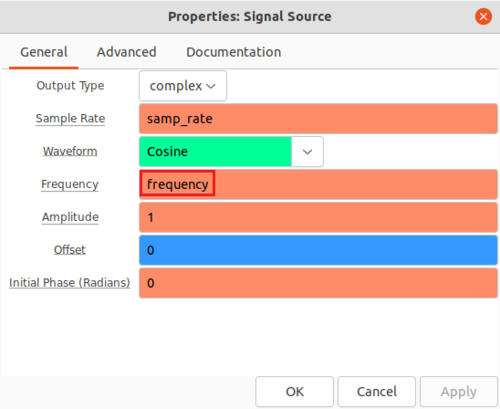
Double-click the Signal Source block and enter frequency from the QT GUI Range variable:
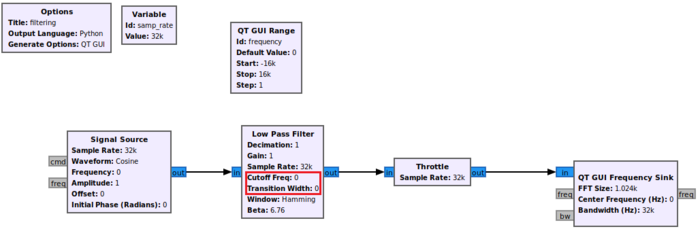
Click OK to save. The flowgraph looks like the following image. Notice that the Low Pass Filter has a Cutoff Freq and Transition Width of 0:
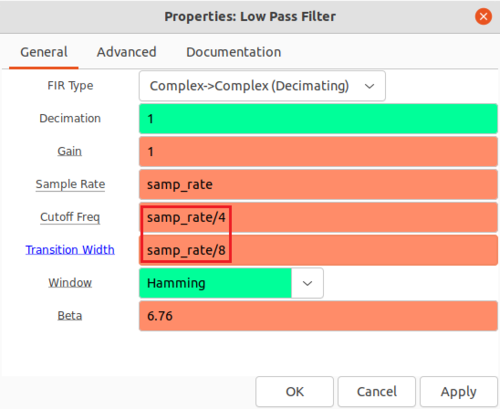
Double-click the Low Pass Filter block and edit the properties:
- Cutoff freq: samp_rate/4
- Transition Width: samp_rate/8
The flowgraph is complete and looks like the following:
Run the Flowgraph
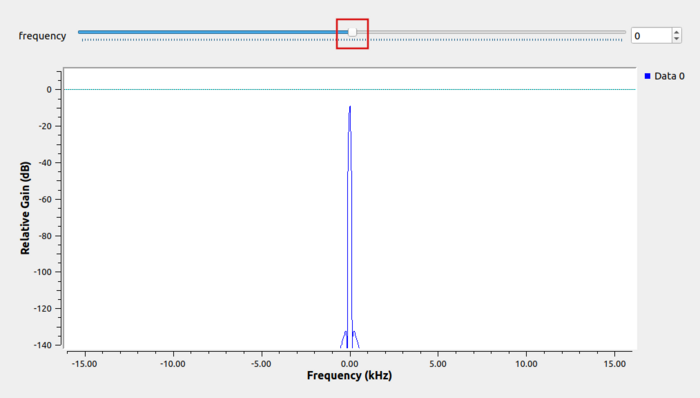
The flowgraph is complete! Run the flowgraph. The QT GUI Frequency Sink appears with a frequency slider bar:
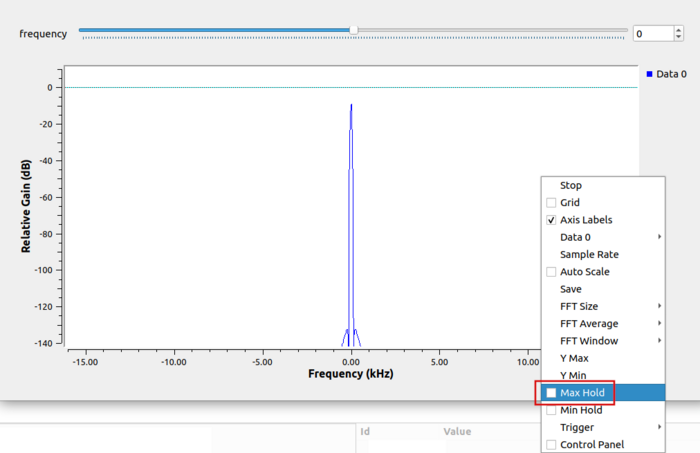
Scroll-wheel-click on the QT GUI Frequency window and select Max Hold:
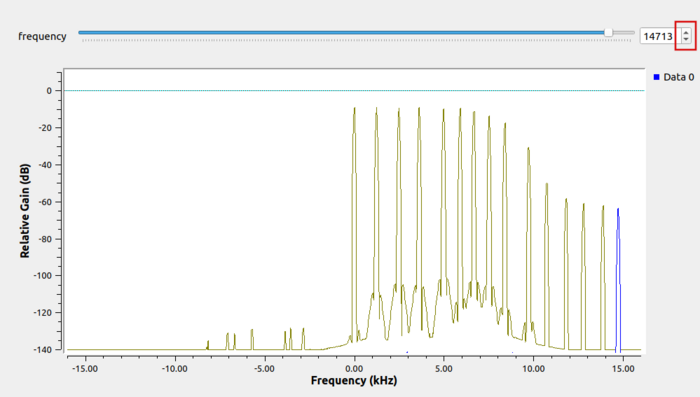
The Max Hold option retains and displays the maximum value at each frequency until the the flowgraph is closed. Clicking through multiple values of the frequency slider bar at the top shows the low pass filter response:
The Impulse Response
The impulse response of a filter shows the entire response of that filter. In digital signal processing, it's possible to see the impulse response by doing just that, feeding an impulse to the filter and viewing its output.
To view the impulse response, make the following adjustments to the flowgraph above:
- Change the "Signal Source" block to a "Vector Source" block. NOTE: The "Range" block is no longer necessary, and can be deleted.
- Add a "Variable" block.
The flowgraph will appear as follows:
Make the following changes to the different blocks:
new Variable block
- ID: N
- Value: 1024
Vector Source block
- Vector: (N,)+(0,)*int(N-1)
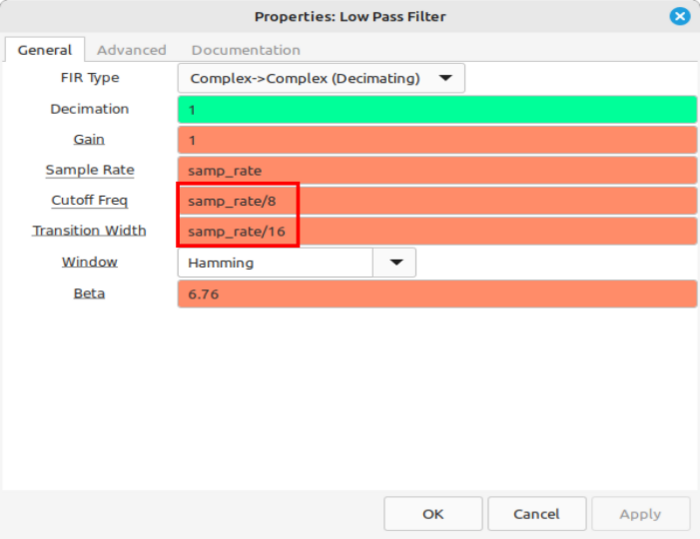
Low Pass Filter block
- Cutoff Freq: samp_rate/8
- Transition Width: samp_rate/16
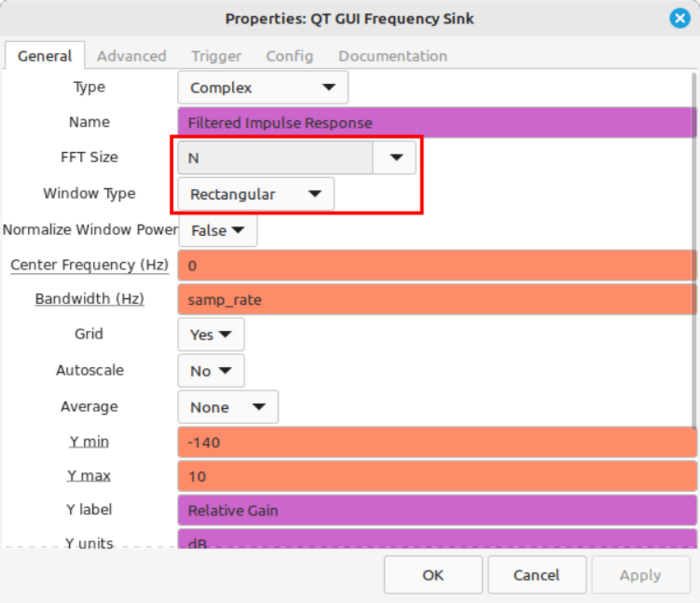
QT GUI Frequency Sink block
- FFT Size: N
- Window Type: Rectangular
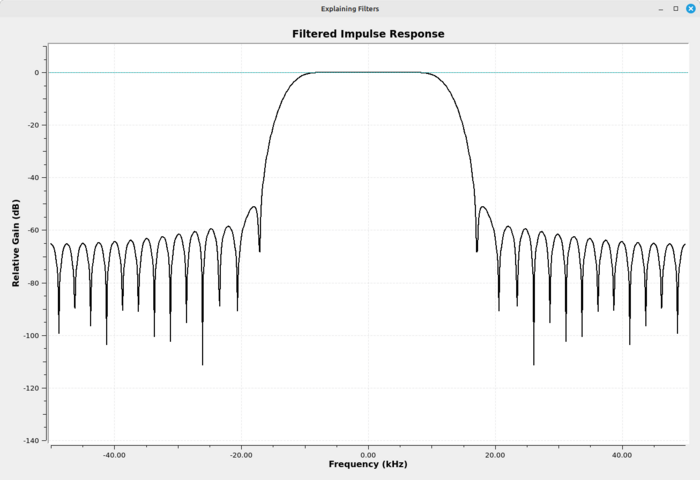
Running the flowgraph shows the following spectrum:
The output of the Vector Source block is a single impulse followed by a lot of zeros. This addition of the extra zeros is called zeropadding. The impulse is convolved in the Low Pass Filter. The output of the filter passes into the QT GUI Frequency Sink block, which creates the spectral display. Because of the zeropadding, the spectral trace is a smooth curve showing the full spectrum of the filter. Note that the frequency sink is set to use a Window Type of Rectangular since the input is essentially self-windowed. Any other type of window in the QT GUI Frequency Sink block will create a display that will be greatly reduced in amplitude.
You can change the Cutoff Freq, Transition Width, and Window in the properties for the Low Pass Filter block in order to see how it affects the output spectrum.
Noise Instead of Signal
Lastly, try replacing the Signal Source or Vector Source with a Noise Source (or Fast Noise Source, they do the same thing), and note how the output changes.
Next Steps
The next tutorial, Designing Filter Taps, describes how to design a set of low-pass filter taps and apply them against a signal.
