Uploads by Jesternofool
Jump to navigation
Jump to search
This special page shows all uploaded files.
| Date | Name | Thumbnail | Size | Description | Versions |
|---|---|---|---|---|---|
| 22:43, 18 August 2025 | Measuring-FM-deviation-display-NWR.png (file) | 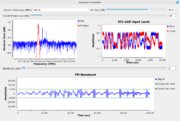 |
109 KB | 1 | |
| 22:40, 18 August 2025 | Measuring-FM-deviation-display-FM-broadcast.png (file) | 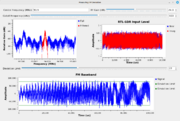 |
128 KB | 1 | |
| 22:37, 18 August 2025 | Measuring-FM-deviation-flowgraph.jpg (file) | 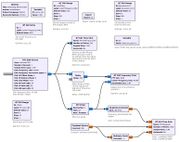 |
194 KB | 1 | |
| 20:37, 18 August 2025 | Aircraft-navigation-signal-full-display-annotated.jpg (file) | 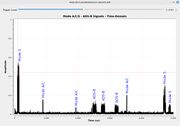 |
100 KB | 1 | |
| 20:30, 18 August 2025 | Aircraft-navigation-signal-ADSB.png (file) | 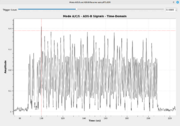 |
101 KB | Time domain display of an aircraft Mode S or ADS-B transmission. Such transmissions are roughly 120 usec long and consist of 1 usec long bursts encoded with pulse position modulation (PPM) modulated onto the carrier using on-off keying (OOK). | 1 |
| 20:27, 18 August 2025 | Aircraft-navigation-signal-ModeAC.png (file) | 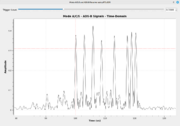 |
73 KB | This is a Mode A or Mode C transmission. It's a roughly 21 usec transmission consisting of up to 14 bursts. This was captured with a RTL-SDR at 2.4 MHz, then upsampled to 24 MHz to smooth out the time domain display. | 1 |
| 20:21, 18 August 2025 | Aircraft-navigation-signal-full-display.png (file) |  |
55 KB | 1 | |
| 20:11, 18 August 2025 | Aircraft-navigation-receiver-flowgraph.jpg (file) |  |
92 KB | Flowgraph to create a receiver for Mode A/C/S and ADS-B aircraft navigation signals. The SDR front end is a RTL-SDR. | 1 |
| 19:12, 18 August 2025 | Time-domain-display-with-trigger-stable-waveform.png (file) |  |
39 KB | 1 | |
| 19:03, 18 August 2025 | Time-domain-varying-no-trigger.gif (file) |  |
135 KB | 1 | |
| 19:02, 18 August 2025 | Time-domain-untriggered-flowgraph.jpg (file) |  |
42 KB | 1 | |
| 19:02, 18 August 2025 | Time-sink-trigger-tab-defaults.png (file) | 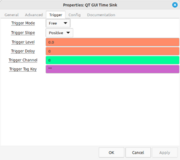 |
24 KB | 1 | |
| 19:01, 18 August 2025 | Time-domain-display-showing-trigger-level-and-slope.jpg (file) |  |
37 KB | 1 | |
| 19:01, 18 August 2025 | Time-domain-display-video-signal-large-time.png (file) | 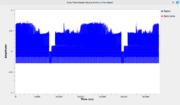 |
42 KB | Time domain display of a NTSC video signal showing two fields of video. | 1 |
| 18:59, 18 August 2025 | Time-domain-display-video-signal-cursor2.png (file) | 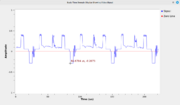 |
38 KB | 1 | |
| 18:59, 18 August 2025 | Time-domain-display-video-signal-cursor1.png (file) | 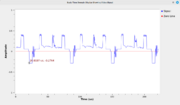 |
38 KB | 1 | |
| 18:58, 18 August 2025 | Time-domain-display-baseband-NTSC-video-signal.png (file) | 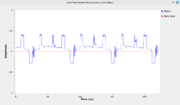 |
35 KB | Time domain display showing several lines of a NTSC (National Television System Committee) video signal. | 1 |
| 18:58, 18 August 2025 | Time-domain-display-flowgraph-video-signal.jpg (file) |  |
115 KB | 1 | |
| 18:57, 18 August 2025 | TimeDisplay02.jpg (file) |  |
76 KB | 1 | |
| 18:57, 18 August 2025 | MeasuringTimePeriod.jpg (file) |  |
37 KB | 1 | |
| 18:55, 18 August 2025 | Time-domain-with-zero-line.png (file) |  |
30 KB | 1 | |
| 18:55, 18 August 2025 | Basic-time-display-flowgraph-02.jpg (file) | 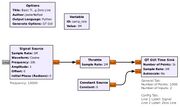 |
89 KB | Basic time display flowgraph with zero line input. | 1 |
| 18:52, 18 August 2025 | TimeDisplay01.png (file) |  |
33 KB | Time display showing basic sinewave. | 1 |
| 18:20, 18 August 2025 | MeasuringTimeAmplitude.jpg (file) |  |
44 KB | How to measure amplitude of a time domain waveform. | 1 |
| 18:19, 18 August 2025 | Basic-time-display-flowgraph-01.jpg (file) |  |
39 KB | Basic flowgraph to demonstrate a time domain display. | 1 |
| 18:18, 18 August 2025 | HP120B-oscope-Jeff-Peletz.jpg (file) | 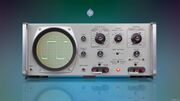 |
831 KB | Image of a Hewlett-Packard 120B analog oscilloscope. | 1 |
| 16:18, 29 July 2025 | SoapyHackrfSource.jpg (file) | 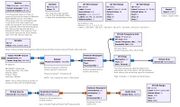 |
209 KB | Corrected "bandwidth" setting | 2 |
| 14:46, 29 July 2025 | SoapyHackRF-Source-display.png (file) | 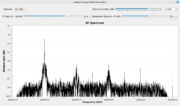 |
56 KB | Frequency display showing NOAA weather radio service signals and controls for the SoapyHackRF source block. | 1 |
| 14:14, 29 July 2025 | HackRF-One-fully-annotated.jpg (file) | 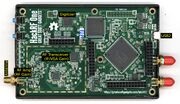 |
928 KB | 2 | |
| 00:41, 26 July 2025 | NovelTextfromDescrambler.jpg (file) | 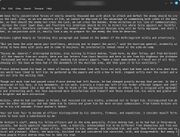 |
270 KB | Terminal showing text from output of simple example of "Descrambler" block. | 1 |
| 00:39, 26 July 2025 | DescramblerTimeDomainDisplay.png (file) | 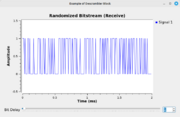 |
33 KB | Time domain display from simple example of the "Descrambler" block. | 1 |
| 00:36, 26 July 2025 | DescramblerExampleFlowgraph.jpg (file) |  |
80 KB | Simple example flowgraph for the use of the "Descrambler" block. | 1 |
| 00:32, 26 July 2025 | ScramblerTimeDomainDisplay.png (file) | 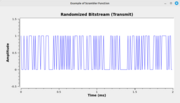 |
32 KB | Time domain display of randomized bitstream from the "Scrambler" block. | 1 |
| 00:25, 26 July 2025 | ScramblerExampleFlowgraph.jpg (file) |  |
79 KB | Flowgraph for a simple example of the "Scrambler" block. | 1 |
| 19:37, 25 July 2025 | Multiplicative-descrambler-7-stage-diagram.jpg (file) |  |
29 KB | 1 | |
| 21:57, 24 July 2025 | Multiplicative-scrambler-7-stage-diagram.jpg (file) |  |
26 KB | 2 | |
| 01:18, 24 July 2025 | Polyphase-channelizer-example-with-RTLSDR.jpg (file) |  |
184 KB | 1 | |
| 23:52, 23 July 2025 | Spectrum-divided-into-12-channels-annotated.jpg (file) |  |
110 KB | This image is used to describe the Polyphase Channelizer block. | 1 |
| 23:43, 23 July 2025 | Channelized-FM-broadcast-spectrum.png (file) | 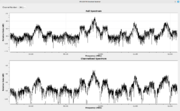 |
71 KB | This is used in the Polyphase Channelizer block description. | 1 |
| 00:33, 19 July 2025 | RTL-SDR-FM-Receiver-display-with-volume-control.png (file) | 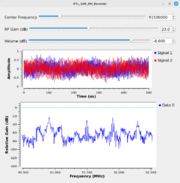 |
106 KB | 1 | |
| 00:27, 19 July 2025 | RTL-SDR-FM-Receiver-Multiply-Const-properties-annotated.png (file) |  |
32 KB | 1 | |
| 00:25, 19 July 2025 | RTL-SDR-FM-Receiver-volume-range-properties-annotated.png (file) | 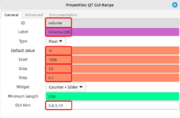 |
56 KB | 1 | |
| 00:11, 19 July 2025 | RTL-SDR-FM-Receiver-with-volume-control.jpg (file) |  |
91 KB | This image is used in the "RTL-SDR FM Receiver" tutorial. | 1 |
| 23:59, 18 July 2025 | RTL-SDR-FM-Receiver-90M9CF.png (file) | 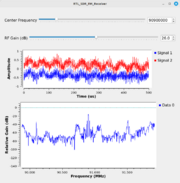 |
85 KB | This image is used in the "RTL-SDR FM Receiver" tutorial. | 1 |
| 23:34, 18 July 2025 | RTL-SDR-FM-Receiver-original.jpg (file) |  |
77 KB | This image is used in the "RTL-SDR FM Receiver" tutorial. | 1 |
| 23:31, 18 July 2025 | RTL-SDR-FM-receiver-no-rational-resampler.jpg (file) |  |
69 KB | This image is used in the "RTL-SDR FM Receiver" tutorial. | 1 |
| 03:02, 18 July 2025 | RTL-SDR-FM-Receiver-31-gain.png (file) | 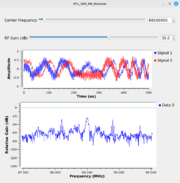 |
78 KB | 1 | |
| 02:56, 18 July 2025 | RTL-SDR-FM-Receiver-10-gain.png (file) | 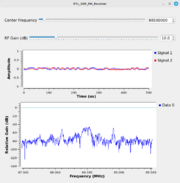 |
49 KB | 1 | |
| 02:48, 18 July 2025 | RtlsdrFmReceiverNoDemod.jpg (file) | 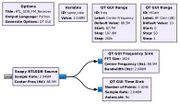 |
56 KB | 1 | |
| 02:45, 18 July 2025 | RtlsdrFmReceiverSourceOnly.jpg (file) |  |
39 KB | 1 |