Sample Rate Change: Difference between revisions
Mattcarrick (talk | contribs) |
(linking against new tutorial) |
||
| (34 intermediate revisions by 6 users not shown) | |||
| Line 1: | Line 1: | ||
{{Template: | <div style="float:right"> | ||
{{Template:BeginnerTutorials}} | |||
</div> | |||
This tutorial describes how to implement sample rate change within GNU Radio. | This tutorial describes how to implement sample rate change within GNU Radio. | ||
The previous tutorial, [[Designing_Filter_Taps|Designing Filter Taps]], demonstrates how to design filter taps and use them in signal processing blocks. Please complete the [[Designing_Filter_Taps|Designing Filter Taps]] tutorial before completing this one. | The previous tutorial, [[Designing_Filter_Taps|Designing Filter Taps]], demonstrates how to design filter taps and use them in signal processing blocks. Please complete the [[Designing_Filter_Taps|Designing Filter Taps]] tutorial before completing this one. The next tutorial, [[Frequency_Shifting|Frequency Shifting]], describes how to apply a frequency shift to a signal both mathematically and with DSP blocks. | ||
== Interpolation == | == Interpolation == | ||
Interpolation is the process of increasing the sampling rate and thus the available bandwidth. This example | Interpolation is the process of increasing the sampling rate and thus the available bandwidth. This example demonstrates how to increase the sampling rate using the ''Interpolating FIR Filter'' block. | ||
Start by adding the following blocks to the flowgraph and connect them: | Start by adding the following blocks to the flowgraph and connect them: | ||
| Line 16: | Line 17: | ||
# ''Interpolating FIR Filter'' | # ''Interpolating FIR Filter'' | ||
# ''Throttle'' | # ''Throttle'' | ||
# ''QT Frequency | # ''QT GUI Frequency Sink'' | ||
[[File:InterpolationFlowgraphStart.png|700px]] | [[File:InterpolationFlowgraphStart.png|700px]] | ||
| Line 27: | Line 28: | ||
Edit the second of the two new variable blocks: | Edit the second of the two new variable blocks: | ||
* Id: ''samp_rate_interpolated'' | * Id: ''samp_rate_interpolated'' | ||
* Value: ''samp_rate*interpolation_rate | * Value: ''samp_rate*interpolation_rate'' | ||
Edit the properties of the ''Low-Pass Filter Taps'' block: | Edit the properties of the ''Low-Pass Filter Taps'' block: | ||
| Line 36: | Line 37: | ||
[[File:EditLowPassTapsProperties.png|500px]] | [[File:EditLowPassTapsProperties.png|500px]] | ||
Edit the properties of the ''QT GUI Range'' block: | Edit the properties of the ''QT GUI Range'' block: | ||
| Line 52: | Line 54: | ||
[[File:InterpolatingFIRFilterProperties.png|500px]] | [[File:InterpolatingFIRFilterProperties.png|500px]] | ||
The ''Interpolating FIR Filter'' | |||
The ''Interpolating FIR Filter'' increases the sampling rate from 32 kHz to 128 kHz, a factor of 4 due to the ''interpolation_rate'' variable. Make a note of this by editing the ''Comment'' field under the ''Advanced'' tab: | |||
[[File:AddCommentToBlock.png|500px]] | [[File:AddCommentToBlock.png|500px]] | ||
== | The comment is then displayed as a visual reminder in GRC: | ||
[[File:SampleRateBlockComment.png|700px]] | |||
Edit the ''Throttle'' property: | |||
* Sample Rate: ''samp_rate_interpolated'' | |||
Edit the ''QT GUI Frequency Sink'' property: | |||
* Bandwidth (Hz): ''samp_rate_interpolated'' | |||
The flowgraph looks like the following: | |||
[[File:InterpolationFinalFlowgraph.png|700px]] | |||
Running the flowgraph shows the following ''QT GUI Frequency Sink'': | |||
[[File:RunInterpolationFlowgraph.png|500px]] | |||
The four peaks come from the interpolation operation. Scroll-wheel-click on the window and enable ''Max Hold'': | |||
[[File:InterpolationClickMaxHold.png|500px]] | |||
Drag the frequency slider to show how the four peaks change in frequency, creating an outline of the frequency response of the ''Interpolating FIR Filter'' block. The interpolation has increased the sampling rate by a factor of 4, with the low-pass filter taps attenuating the spectral images to minimize distortion. | |||
[[File:InterpolationMaxHoldOutline.png|500px]] | |||
== Decimation (Source hardware example) == | |||
Where interpolation increases the sample rate, decimation decreases the sample rate and available bandwidth. | |||
The following discussion is based on the flowgraph of a RadioTeleTYpe (RTTY) receiver. It can be found at [https://raw.githubusercontent.com/duggabe/gr-RTTY-basics/master/RTTY_rcv/RTTY_receive.grc RTTY_receive.grc] | |||
[[File:RTTY_rcv.png|800px]] | |||
Frequency shift keying (FSK) tones are input to the microphone jack of the computer which has a sample rate of 48 kHz. That data is fed to a [[Frequency Xlating FIR Filter]] which shifts the tones above and below the center frequency. It also decimates (divides) the sample rate by 50, producing an output sample rate of 960. | |||
The [[Quadrature Demod]] produces a signal which is positive or negative depending on whether the tone is above or below the center frequency. | |||
The RTTY symbol time is, by definition, exactly 22 ms. yielding the familiar 45 baud (1/0.022 rounded). To get an integer number of samples per symbol, a sample rate of 500 was chosen, producing 11 samples per symbol time. (500 samples/sec * 0.022 seconds = 11 samples). | |||
The output of the Quadrature Demod block has a sample rate of 960; the desired sample rate is 500. The [[Rational Resampler]] interpolates (multiplies) the sample rate by 500 and decimates (divides) it by 960 to produce an output sample rate of 500. | |||
The [[Binary Slicer]] produces an output of +1 for inputs greater than zero, and 0 for inputs less than zero. | |||
The 'Terminal Display Sink' is an [[Embedded Python Block]] which reads the input stream of 1's and 0's, synchronizes on the start bit, creates a Baudot character from the five data bits, converts Baudot to UTF-8, and outputs the characters to a [[ZMQ PUSH Message Sink]]. | |||
The [https://github.com/duggabe/ gr-webserver] package can receive the messages from the message sink and display them on a browser screen. | |||
The next tutorial, [[Frequency_Shifting|Frequency Shifting]], describes how to apply a frequency shift to a signal both mathematically and with DSP blocks. | |||
Latest revision as of 22:16, 12 June 2024
| Beginner Tutorials
Introducing GNU Radio Flowgraph Fundamentals
Creating and Modifying Python Blocks DSP Blocks
SDR Hardware |
This tutorial describes how to implement sample rate change within GNU Radio.
The previous tutorial, Designing Filter Taps, demonstrates how to design filter taps and use them in signal processing blocks. Please complete the Designing Filter Taps tutorial before completing this one. The next tutorial, Frequency Shifting, describes how to apply a frequency shift to a signal both mathematically and with DSP blocks.
Interpolation
Interpolation is the process of increasing the sampling rate and thus the available bandwidth. This example demonstrates how to increase the sampling rate using the Interpolating FIR Filter block.
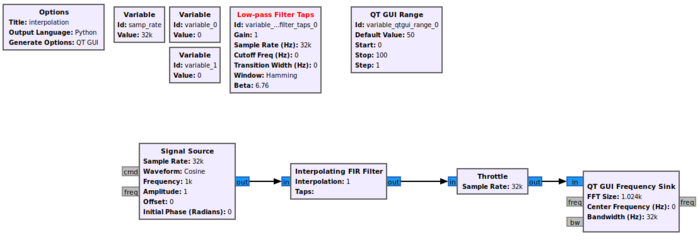
Start by adding the following blocks to the flowgraph and connect them:
- Two Variable blocks
- Low-Pass Filter Taps
- QT GUI Range
- Signal Source
- Interpolating FIR Filter
- Throttle
- QT GUI Frequency Sink
Edit the first of the two new variable blocks:
- Id: interpolation_rate
- Value: 4
Edit the second of the two new variable blocks:
- Id: samp_rate_interpolated
- Value: samp_rate*interpolation_rate
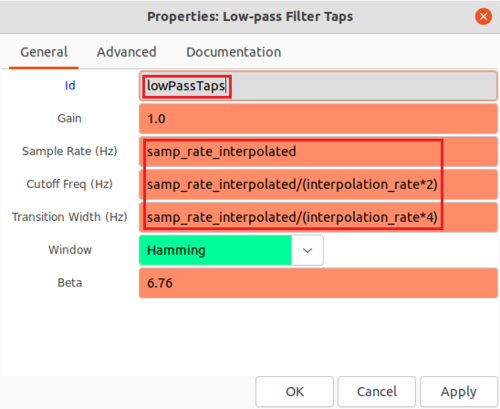
Edit the properties of the Low-Pass Filter Taps block:
- Id: lowPassTaps
- Sample Rate (Hz): samp_rate_interpolated
- Cutoff Freq (Hz): samp_rate_interpolated/(interpolation_rate*2)
- Transition Width (Hz): samp_rate_interpolated/(interpolation_rate*4)
Edit the properties of the QT GUI Range block:
- Id: frequency
- Default Value: 0
- Start: -samp_rate/2
- Stop: samp_rate/2
Edit the property of the Signal Source:
- Frequency: frequency
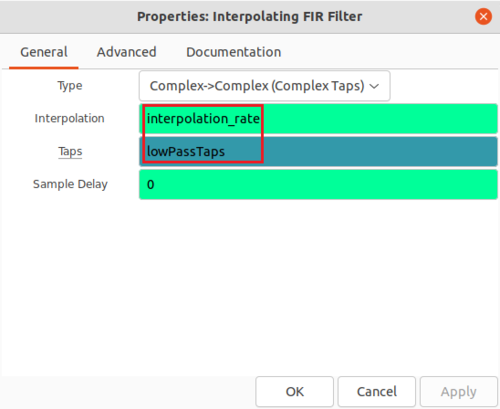
Edit the properties of the Interpolating FIR Filter block:
- Interpolation: interpolation_rate
- Taps: lowPassTaps
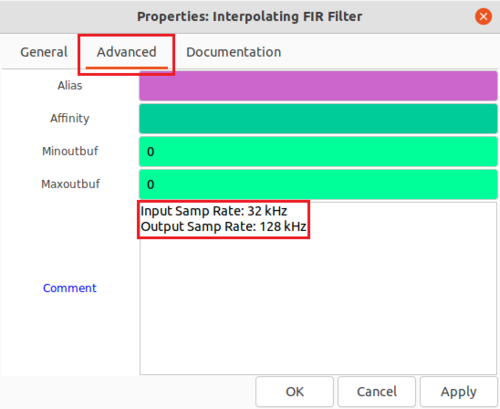
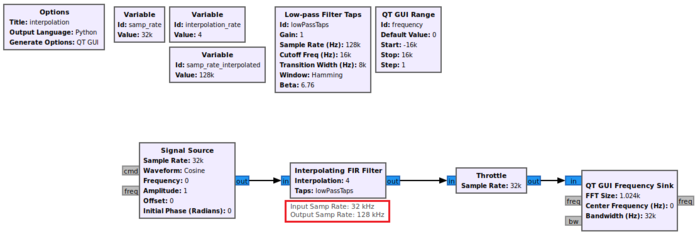
The Interpolating FIR Filter increases the sampling rate from 32 kHz to 128 kHz, a factor of 4 due to the interpolation_rate variable. Make a note of this by editing the Comment field under the Advanced tab:
The comment is then displayed as a visual reminder in GRC:
Edit the Throttle property:
- Sample Rate: samp_rate_interpolated
Edit the QT GUI Frequency Sink property:
- Bandwidth (Hz): samp_rate_interpolated
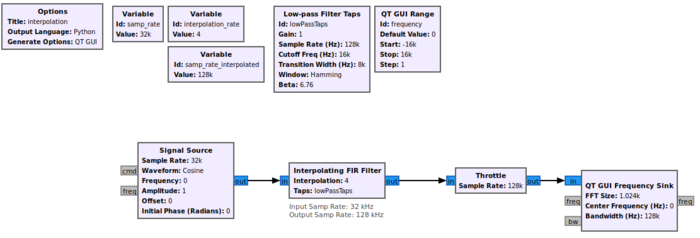
The flowgraph looks like the following:
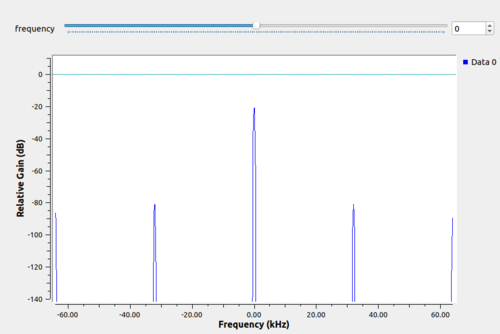
Running the flowgraph shows the following QT GUI Frequency Sink:
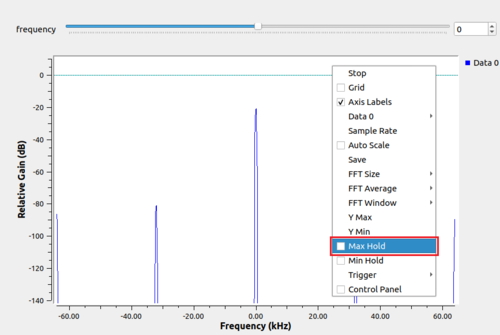
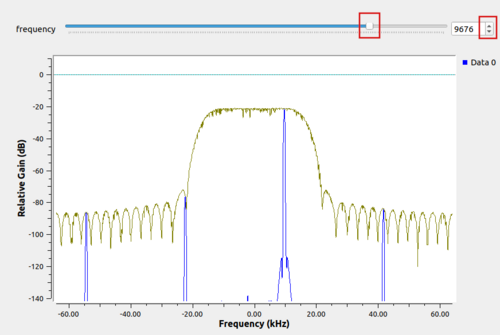
The four peaks come from the interpolation operation. Scroll-wheel-click on the window and enable Max Hold:
Drag the frequency slider to show how the four peaks change in frequency, creating an outline of the frequency response of the Interpolating FIR Filter block. The interpolation has increased the sampling rate by a factor of 4, with the low-pass filter taps attenuating the spectral images to minimize distortion.
Decimation (Source hardware example)
Where interpolation increases the sample rate, decimation decreases the sample rate and available bandwidth.
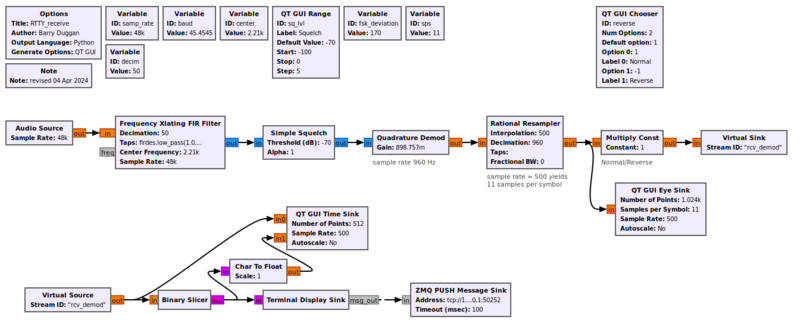
The following discussion is based on the flowgraph of a RadioTeleTYpe (RTTY) receiver. It can be found at RTTY_receive.grc
Frequency shift keying (FSK) tones are input to the microphone jack of the computer which has a sample rate of 48 kHz. That data is fed to a Frequency Xlating FIR Filter which shifts the tones above and below the center frequency. It also decimates (divides) the sample rate by 50, producing an output sample rate of 960.
The Quadrature Demod produces a signal which is positive or negative depending on whether the tone is above or below the center frequency.
The RTTY symbol time is, by definition, exactly 22 ms. yielding the familiar 45 baud (1/0.022 rounded). To get an integer number of samples per symbol, a sample rate of 500 was chosen, producing 11 samples per symbol time. (500 samples/sec * 0.022 seconds = 11 samples).
The output of the Quadrature Demod block has a sample rate of 960; the desired sample rate is 500. The Rational Resampler interpolates (multiplies) the sample rate by 500 and decimates (divides) it by 960 to produce an output sample rate of 500.
The Binary Slicer produces an output of +1 for inputs greater than zero, and 0 for inputs less than zero.
The 'Terminal Display Sink' is an Embedded Python Block which reads the input stream of 1's and 0's, synchronizes on the start bit, creates a Baudot character from the five data bits, converts Baudot to UTF-8, and outputs the characters to a ZMQ PUSH Message Sink.
The gr-webserver package can receive the messages from the message sink and display them on a browser screen.
The next tutorial, Frequency Shifting, describes how to apply a frequency shift to a signal both mathematically and with DSP blocks.
